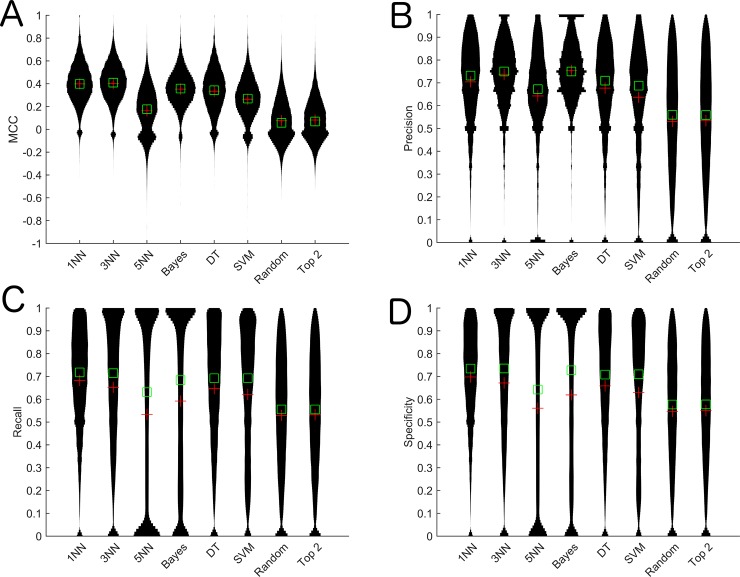
Fig 1. Violin plots of performance metrics for the algorithm when utilizing different classification methods in the SFS algorithm and controls on the breast cancer cell line data.
A) MCC, B) Precision, C) Recall, D) Specificity. Green squares specify the median and the red pluses specify the mean. NB: Naive Bayes, DT: Decision tree, SVM: Support Vector Machine

