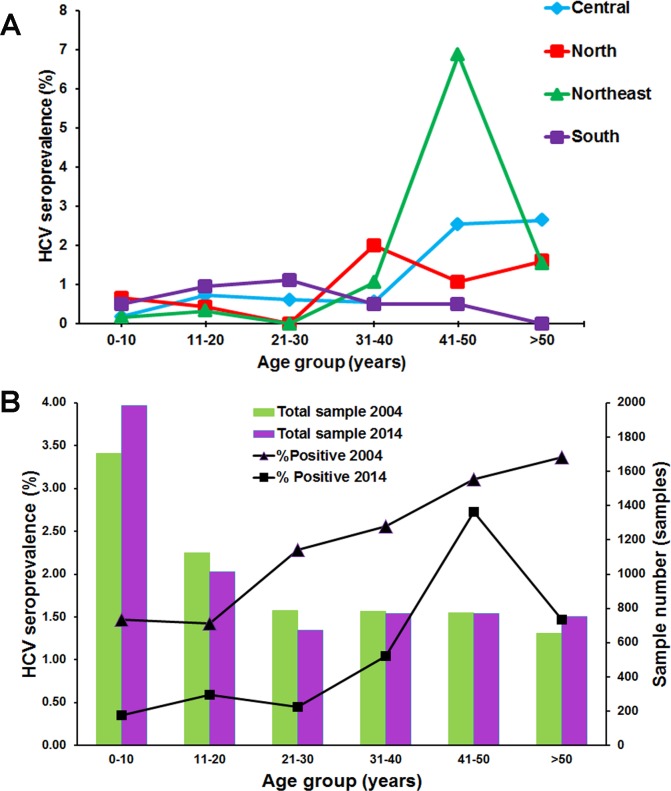
Fig 2. Distribution of HCV seropositive rates in 2014 compared to 2004.
(A) The prevalence of anti-HCV antibody was stratified by age group and geographical region. (B) The number of samples examined in 2004 (green) and 2014 (purple) for each age group. The seroprevalence in 2004 (triangle) [14] and 2014 (square) for each age group.

