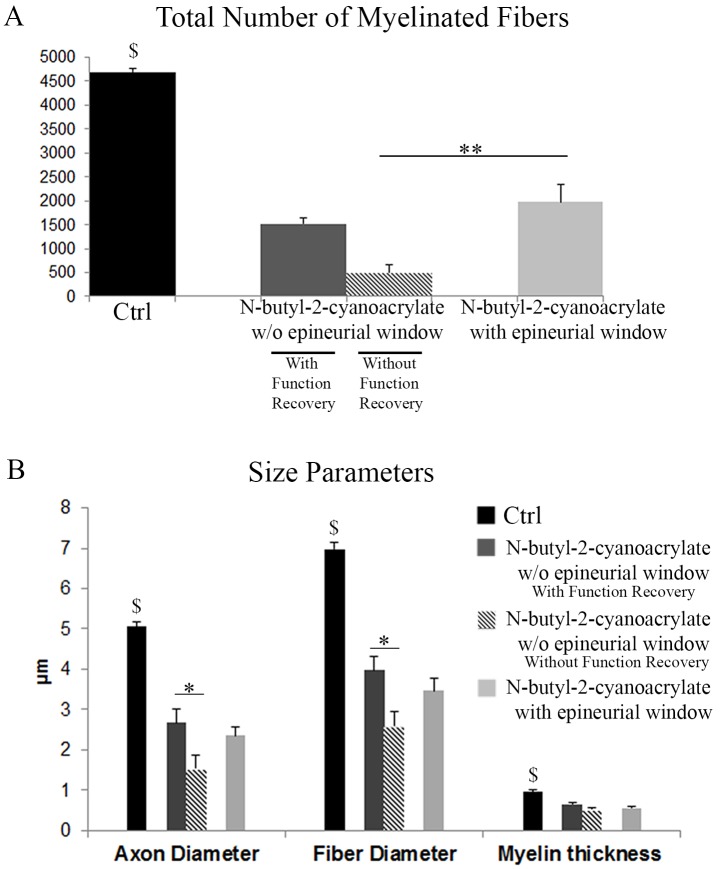
Fig 3. Histograms showing the results of stereological and morphometric evaluations.
Data of Group 1 (N-butyl-2-cyanoacrylate w/o epineurial window) are divided into two parts: animal which displayed functional recovery (n = 3) and animals which did not (n = 4). Group 2 (N-butyl-2-cyanoacrylate with epineurial window) shows more myelinated fibres compared to animals of Group 1 (N-butyl-2-cyanoacrylate w/o epineurial window) without functional recovery. Significant differences are detectable for the analyzed size parameters between animals of Group 1_with functional recovery and animals of Group 1_without functional recovery. Values in the graphics are expressed as mean+standard error. $: p ≤0.001 between control and both the experimental groups; **: p≤0.01; *: p≤0.05.

