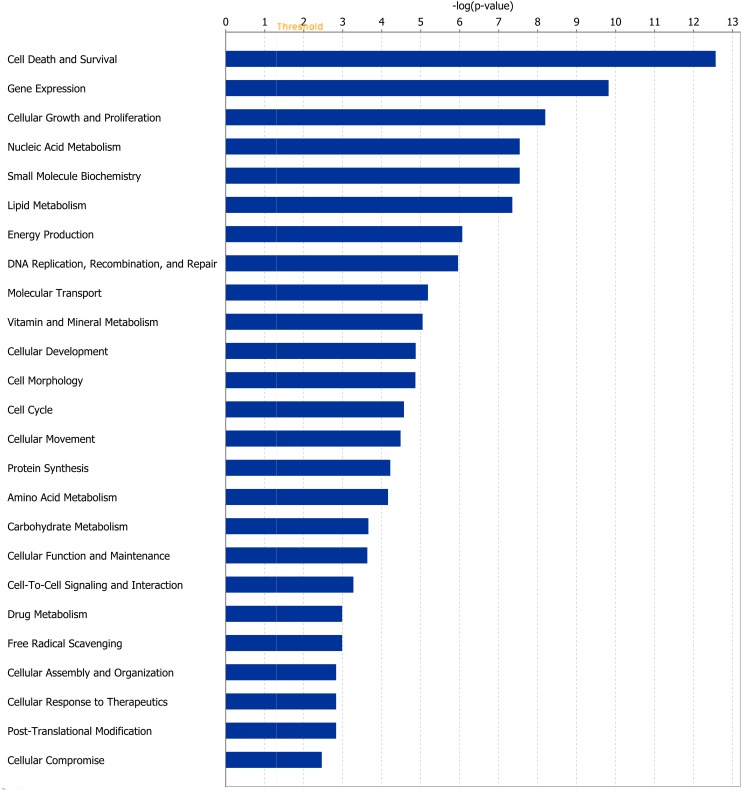
Fig 3. Molecular and cellular function of differentially expressed genes affected by re-alimentation and compensatory growth.
Genes differentially expressed in bovine M. longissimus dorsi classified by molecular and cellular function in response to a period of re-alimentation (15 days) following a prior dietary restriction (120 days) compared with ad libitum-fed cattle. The bars indicate the likelihood [-log (P-value)] that the specific molecular and cellular function was affected by restricted feeding compared with others represented in the list of differentially expressed genes. The threshold line in the bar chart represents a p-value of 0.05.

