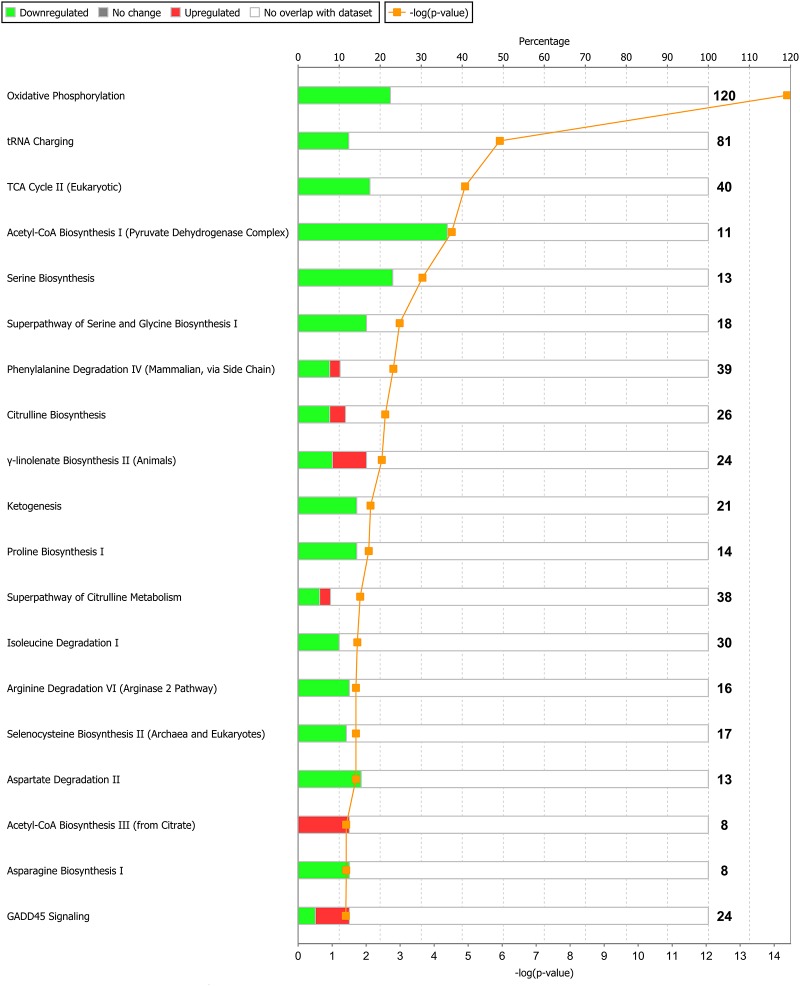
Fig 4. Biochemical pathways significantly enriched in bovine M. longissimus dorsi in response to a period of re-alimentation (15 days) and compensatory growth following a prior period of dietary restriction (120 days) compared with ad libitum-fed cattle.
Green bars represent genes down-regulated and red bars up-regulated genes as percentages of the overall number of genes in each pathway. The significance of each pathway is represented by the yellow line describing—log(p-value). The p-value is calculated by the number of genes from our data-set of differentially expressed genes that participate in a particular pathway and dividing it by the total number of genes in that Canonical Pathway in IPA analysis.

