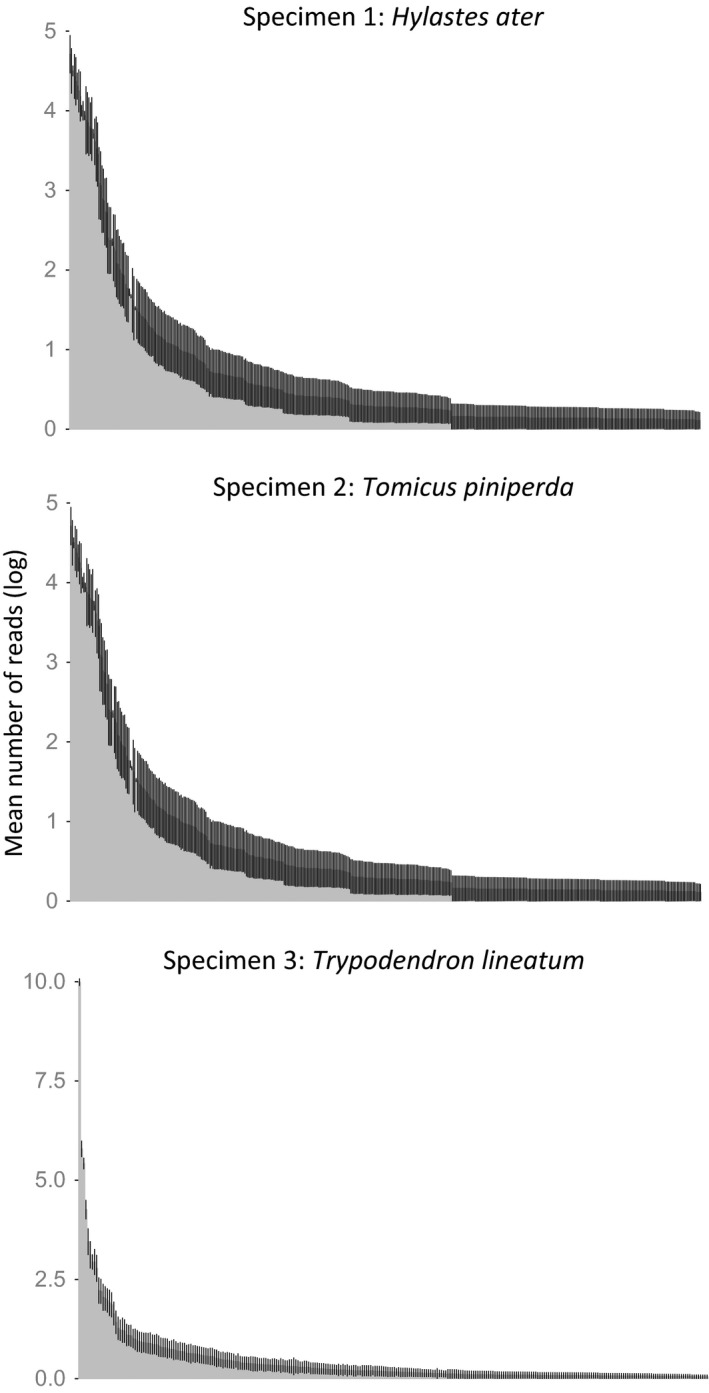
Figure 3.

Rank abundance curve for the number of fungal OTUs showing the mean log number of reads associated with each OTU, separately for each of the three specimens used in this study. Error bars represent standard error of the mean (SEM) for each of 45 replicates (15 separate tags and three PCR replicates each).
