Figure 2.

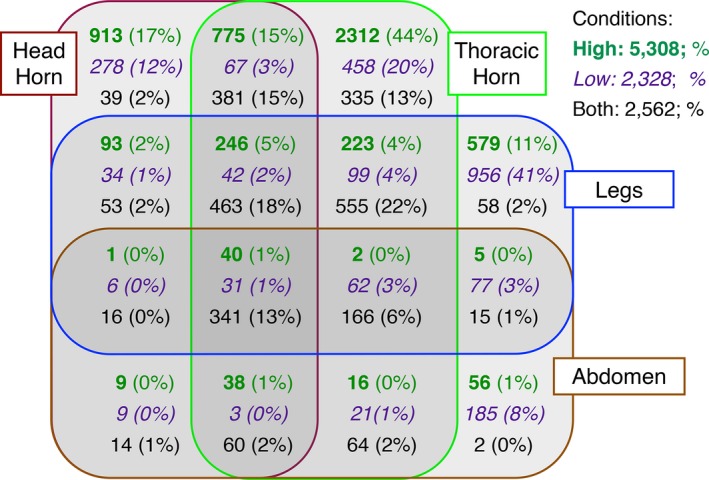
Number of sex‐biased contigs unique to, or shared among, four different tissues. Different colors indicate numbers and percentages of contigs that exhibit sex bias under high (green), low (purple), or both (black) conditions.

Number of sex‐biased contigs unique to, or shared among, four different tissues. Different colors indicate numbers and percentages of contigs that exhibit sex bias under high (green), low (purple), or both (black) conditions.