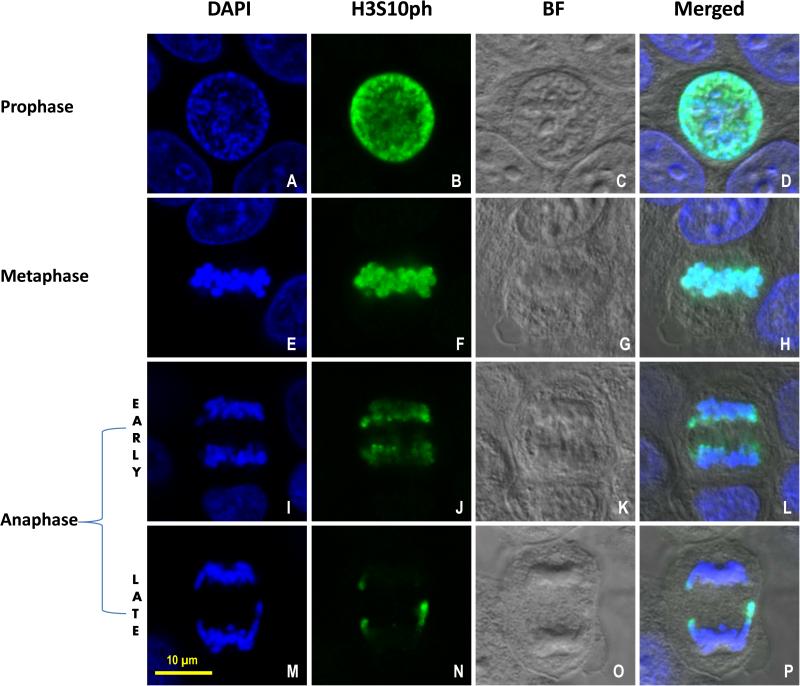
Figure 1.
H3S10ph expression during mitosis in MCF-7 cells. Confocal images of MCF-7 cells representing prophase (A, B, C, D), metaphase (E, F, G, H), early anaphase (I, J, K, L) and late anaphase (M, N, O, P) during mitosis. Blue signal in the first column (A, E, I, M) = DAPI; Green signal in the second column (B, F, J, N) = Histone H3 phosphorylation at Serine 10 (H3S10ph); the third column (C, G, K, O) = Bright field (BF); the fourth column (D, H, L, P) = merged image. Scale bar = 10 μm.

