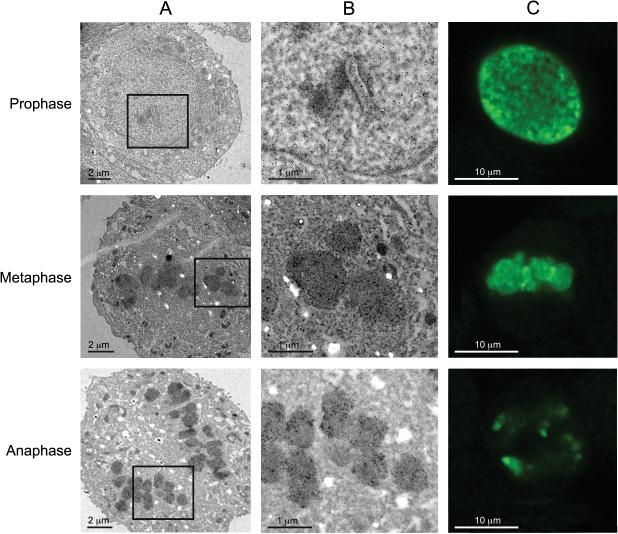
Figure 2.
H3S10ph immunogold staining showing MCF-7 cells in prophase, metaphase and anaphase. (A) At low magnification, dark staining was seen in prophase, metaphase and anaphase, which may represent the immunogold bead signals. (B) At high magnification, immunogold beads can be resolved in prophase, metaphase and anaphase. Note the immunogold bead density gradient within a chromatid cross-section in anaphase. (C) Confocal Green channel displaying H3S10ph signal at prophase, metaphase and anaphase. A, Scale bar = 2 μm; B, Scale bar = 1 μm; C, Scale bar = 10 μm.

