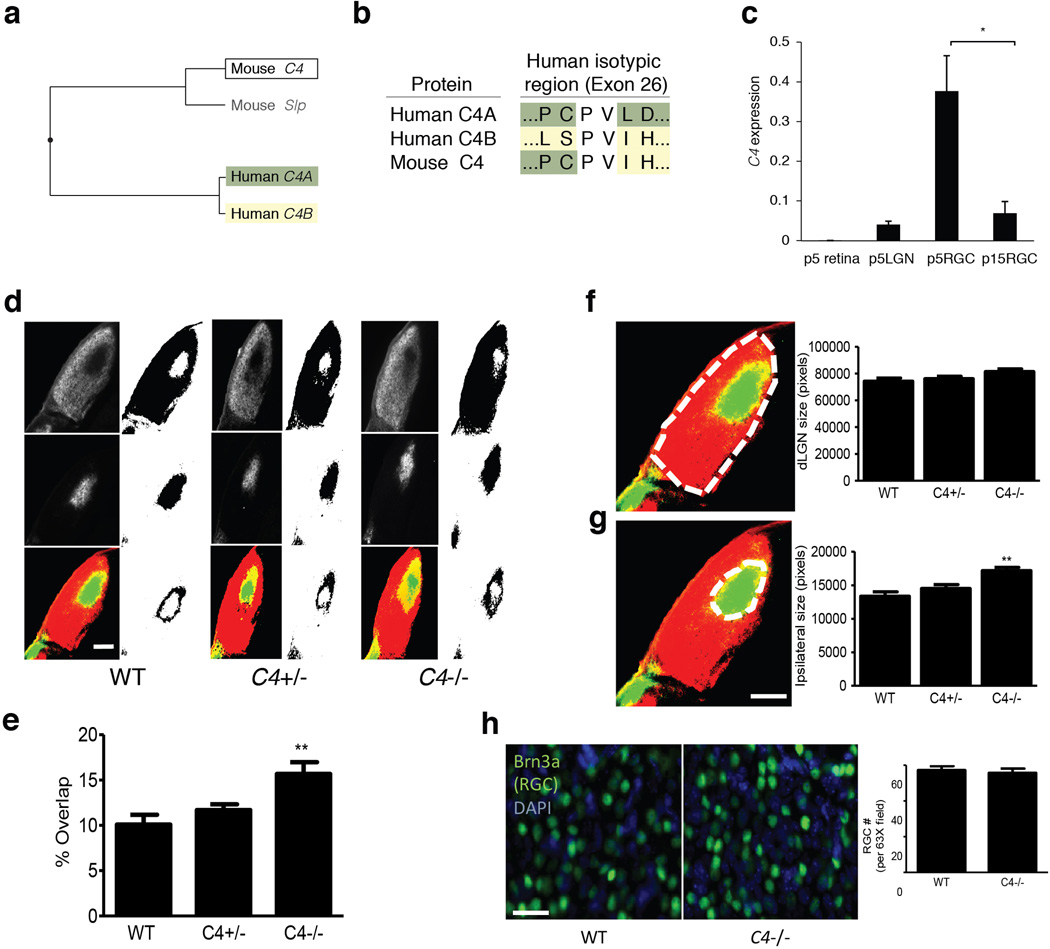
Extended Data Figure 10.
Mouse C4 genes and additional analyses of the dLGN eye segregation phenotype in C4 mutant mice and wild-type and heterozygous littermate controls.
(a) The functional specialization of C4 into C4A and C4B in humans does not have an analogy in mice. Although the mouse genome contains both a C4 gene and a C4-like gene (classically called Slp), and these genes are also present as a tandem duplication within the mouse MHC locus, analysis of the encoded protein sequences indicates a distinct specialization, as illustrated by the protein phylogenetic tree. Above, mouse Slp is indicated in gray to reflect its potential pseudogenization: Slp is already known to have mutations at a C1s cleavage site, which are thought to abrogate activation of the protein through the classical complement pathway56; and the M. musculus reference genome sequence (mm10) at Slp shows a 1-bp deletion (relative to C4) within the coding region at chr17:34815158, which would be predicted to cause a premature termination of the encoded protein. (In some genome data resources, mouse Slp and C4 have been annotated respectively as “C4a” (e.g. NM_011413.2) and “C4b” (e.g. NM_009780.2) based on synteny with the human C4A and C4B genes, but the above sequence analysis indicates that they are not paralogous to C4A and C4B.)
(b) Sequence differences between C4A and C4B – which are otherwise 99.5% identical at an amino acid level – are concentrated at the “isotypic site” where they shape each isotype's relative affinity for different molecular targets19,20. At the isotypic site, mouse C4 contains a combination of the residues present in human C4A and C4B.
(c) Expression of mouse C4 mRNA in whole retina and lateral geniculate nucleus (LGN) from P5 animals and in purified retinal ganglion cells (RGCs) from P5 and P15 animals. These time points were chosen as P5 is a time of more robust synaptic refinement in the retinogeniculate system compared to P15. The same assays detected no C4 RNA in control RNA isolated from C4−/− mice (not shown).
N = 3 samples for p5 retina, LGN, and P15 RGCs, N = 4 samples for P5 RGCs; * p < 0.05 by ANOVA with post hoc Tukey-Kramer multiple-comparisons test.
(d) Representative images of dLGN innervation by contralateral projections (red in bottom image), ipsilateral projections (green in bottom image), and their overlap (yellow in bottom image). Scale bar = 100 µm
(e) Quantification of the percentage of total dLGN area receiving both contralateral and ipsilateral projections shows a significant increase in C4−/− compared to WT littermates (ANOVA, N = 5 mice/group, p < 0.01). These data are consistent with results using R-value analysis as shown in Fig. 7.
(f) Quantification of total dLGN area showed no significant difference between WT and C4−/− mice (ANOVA, N = 5 per group, p > 0.05).
(g) Quantification of dLGN area receiving ipsilateral innervation showed a significant increase in ipsilateral territory in the C4−/− mice compared to WT littermates (AVOVA, N = 5 mice/group, p > 0.01). This result is consistent with defects in eye specific segregation. Scale bar = 100 µm
(h) The number of RGCs in the retina was estimated by counting the number of Brn3a+ cells in WT and C4−/− mice. No differences were observed between WT and C4−/− (t-test, N = 4 mice/group, p > 0.05). Scale bar = 100 µm.

