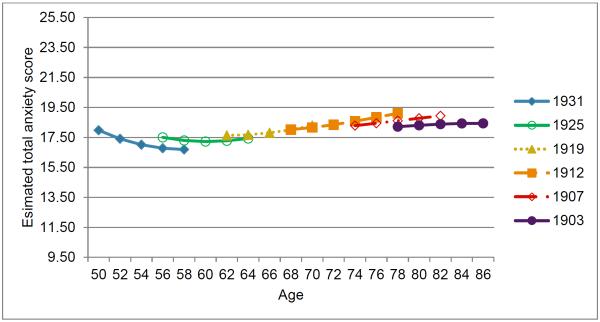
Figure 1.
Plot of estimated ANX over age based on best-fitting phenotypic model (Table 3, column d). Results for six example birth years are shown to demonstrate age cohort differences in anxiety trajectory. Estimated ANX are shown for the observed age range for individuals born in a given year. The range of the Y-axis covers the range of the model-based intercept (17.59) +/− 1 standard deviation of ANX (SD based on Q1 data).

