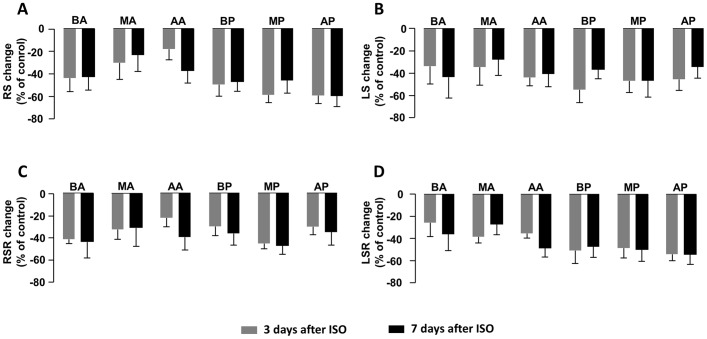
Fig 3. Comparison of changes in regional strain and strain rate after ISO insult.
(A) RS, (B) LS, (C) RSR and (D) LSR in long axis all decreased in each segment of LV at 3 days and 7 days after ISO injection compared with control, however, the change rates of the above parameters did not show any significant difference among the six segments. Data are shown as percentage of changes versus control following ISO injection. Two-way ANOVA is used to compare statistical difference in change rates among the six segments. ISO, isoproterenol; BA, basal anterior; MA, mid-anterior; AA, apical anterior; BP, basal posterior; MP, mid-posterior and AP, apical posterior. n = 6 per group.

