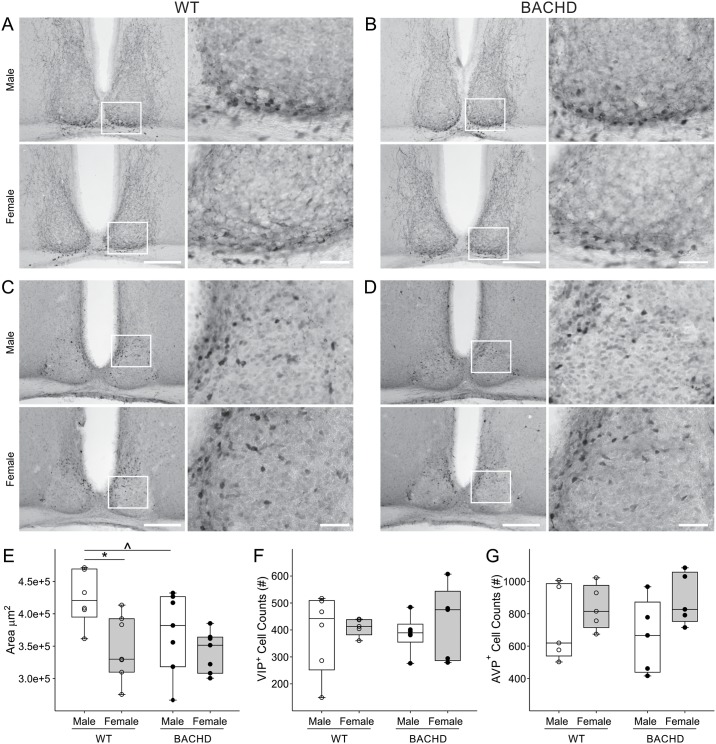
Fig 3. Sex and genotypic difference in the size of the SCN of WT and BACHD mice.
Representative images of the SCN, stained with VIP (A & B) or AVP (C &D) and counterstained with Nissl. Boxed regions in 10x image (left, scale bar = 200μm) are magnified at 40x (right, scale bar = 40μm). (E) Measurements of the Nissl-defined SCN revealed a significantly smaller SCN in 3 month-old WT females compared to age-matched WT male mice. WT females displayed a smaller and elongated SCN, while WT male SCN was larger and round. A significant reduction in the area of the SCN was found in BACHD males as compared to age-matched WT males, while females BACHD did not display pathology-associated variations. Individual data points represent the average of the left and right area of the SCN of each animal (n = 6–7) measured by 2 observers masked to the sex and genotype. No sex or genotypic differences were found in the number of VIP (F) and AVP (G) positive neurons. Individual data points represent the number of positive cell counted per animal for each group (n = 4–6). Individual data points are superimposed onto box plots representing first and third quartile (box), group medians (middle line) and data range (whiskers) for each group. Main effects of sex and genotype were identified by Two-way ANOVA *P<0.05 (see also Table 6). Significant genotypic differences within sex were identified post-hoc by Two-Tailed T-Tests, with ^P < 0.05.

