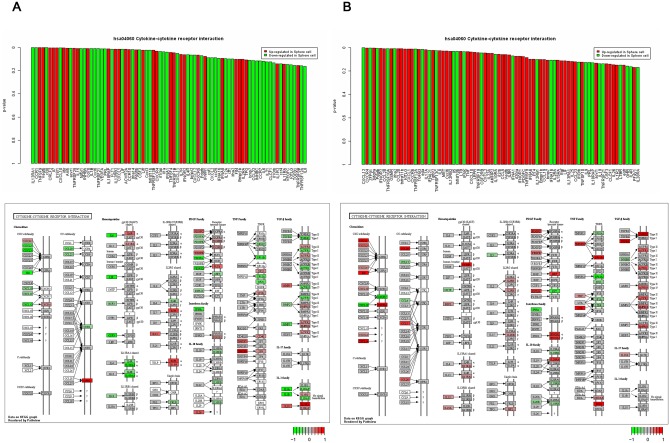
Fig 4. The top shows gene plots of the cytokine-cytokine receptor interaction gene set obtained from Globaltest.
Red and green bars indicate genes that were up-regulated or down-regulated, respectively, in sphere cells. The bottom shows KEGG pathways including the fold-change of individual genes in the cytokine-cytokine receptor interaction gene set. A. Affymetrix datasets. B. Illumina datasets.

