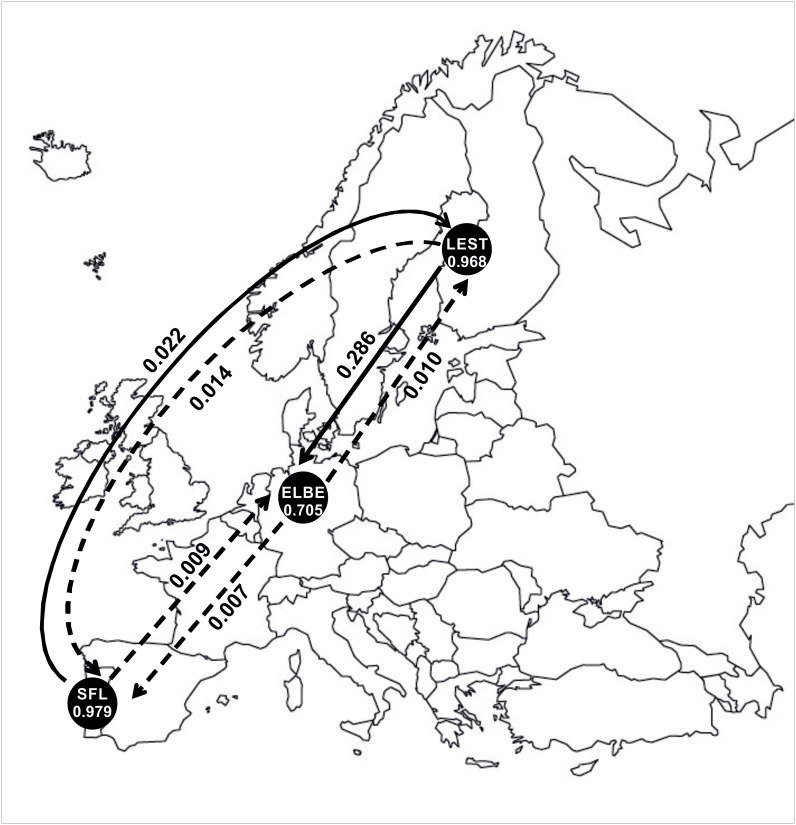
Fig 6. Recent migration rates (m) between migratory populations estimated using BAYESASS.
Within circles, acronyms represent samples as in Fig 1 and Table 1, and numbers denote the proportion of non-immigrants within populations. Arrows indicate direction of gene flow among populations and respective m value. Dashed arrows represent values of m lower than 0.02.

