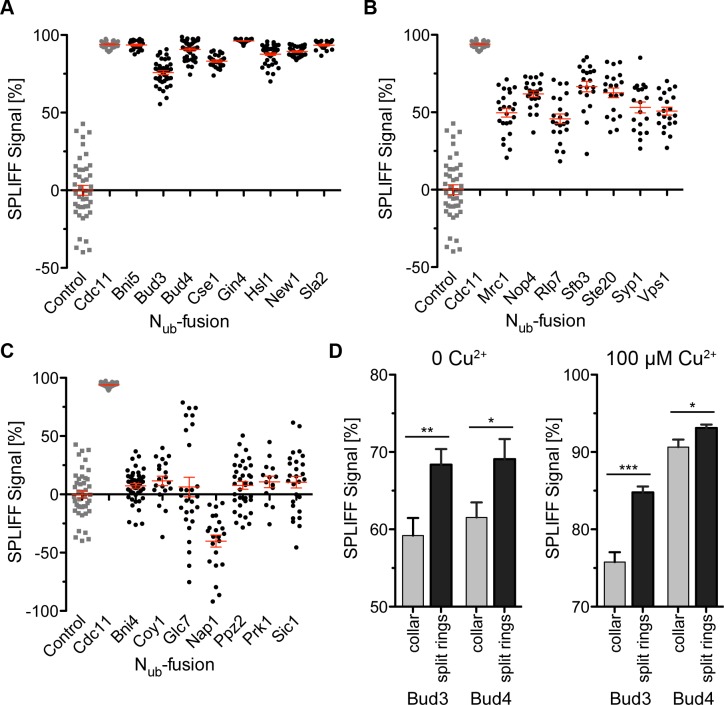
Fig 5. Steady-state SPLIFF measurements.
Each point represents a single cell measurement. The expressions of the Nub -fusion proteins were induced by100 μM Cu2+. The calculated medians and SEMs are shown in red. Nub-fusions are grouped according to their interaction signal. (A) Strong interaction (SPLIFF signal ≥ 70%). (B) Weak interaction (SPLIFF signal ≥ 30%). (C) No interaction (SPLIFF signal ≤ 30%). The negative value for Nap1 might result from a weaker expression of Nap1 than the control Nub. Note a subpopulation of Glc7 cells that have a SPLIFF signal >50%. grey squares: negative control Nub-empty; grey circle: positive control Nub-Cdc11. (D) Comparison between stable collar and split septin rings SPLIFF signals induced by Nub- and -Bud4 with 0 (left) or 100 μM Cu2+ (right).

