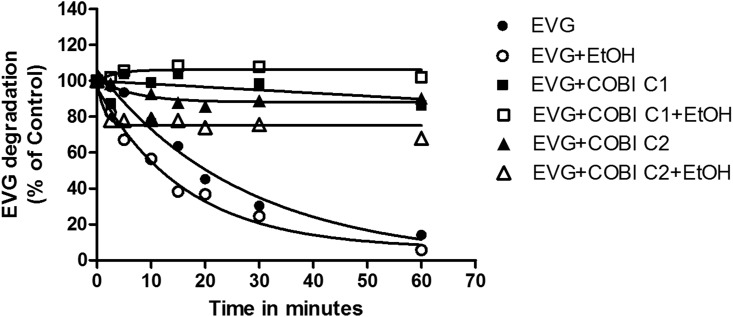
Fig 3. Kinetics of degradation of elvitegravir (EVG) in the human liver microsomes (HLM) in the absence and presence of 20 mM ethanol.
The degradation of EVG (% of control) was plotted by measuring remaining substrate at the specified time intervals. Assay was performed using HLM as a source of enzyme as described in the materials and methods. Mean ± S.E.M values were calculated from the fitting of the curve. The results are representative of at least three independent experiments. COBI C1 represents 4 μM and COBI C2 represents 0.04 μM.

