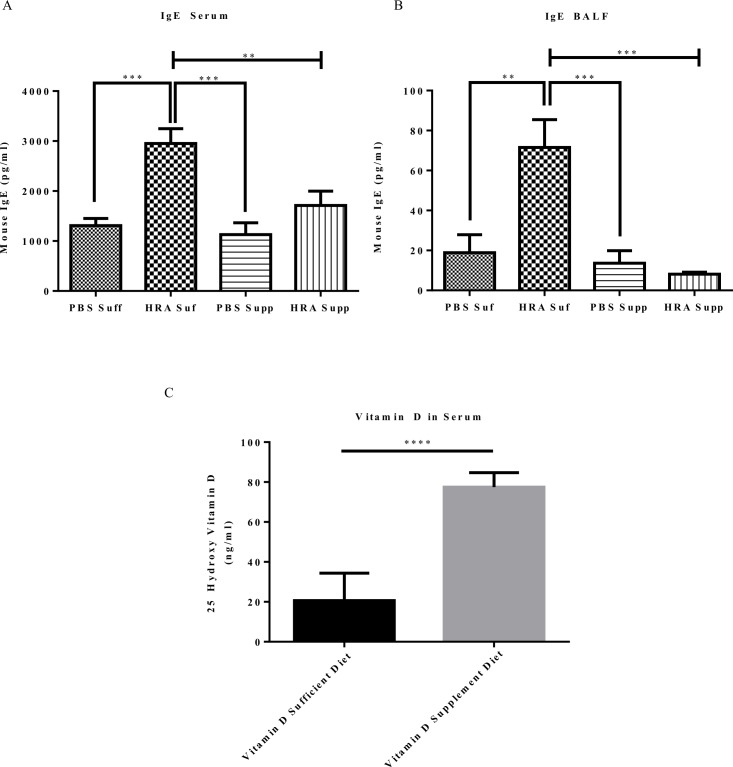
Fig 3. Effect of serum and BALF IgE levels and serum vitamin D levels in vitamin D-sufficient and vitamin D-supplemented mice.
(A) Measurement of IgE in mouse serum. The results are presented as mean ± SEM of 7 mice per group, **p < 0.01; ***p < 0.001; (B) Measurement of IgE in mouse BALF. The results are presented as mean ± SEM of 7 mice per group, **p < 0.01; ***p < 0.001; (C) Serum levels of 25(OH)D in vitamin D-sufficient and vitamin D-supplemented mice. The results are presented as ± SEM of 7 mice per group (****p <0.0001).

