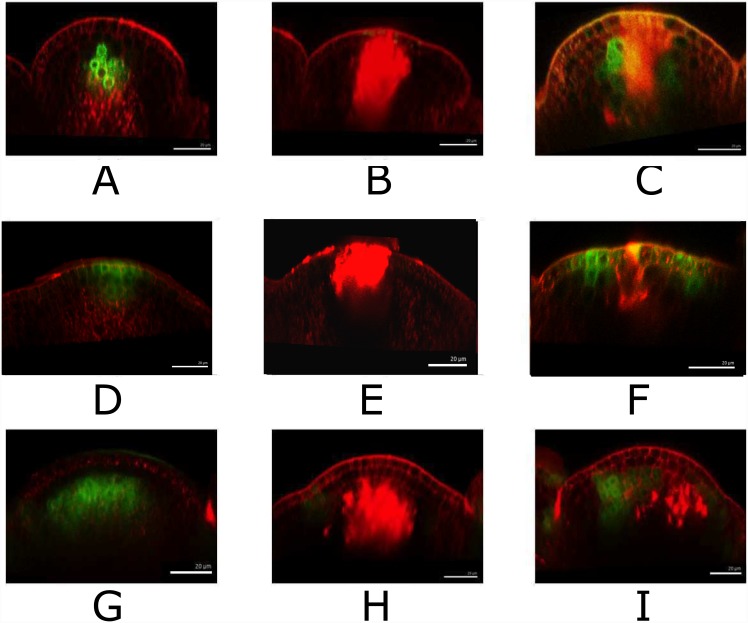
Fig 9. Laser ablation of WUS, CLV3 and TCS domains.
WUS::GFP promoter fusion expression before (A), just after (B) and 1 d after (C) laser ablation. CLV3::GFP expression before (D), just after (E) and 1 d after (F) laser ablation. TCS promoter expression before (G), just after (H) and 2 d (I) after laser ablation. The green signal is WUS::GFP in A, B, C, CLV3::GFP in D, E, F, TCS in G, H, I. Red signal is propidium-iodide (PI)-stained cell wall or laser ablated cells.

