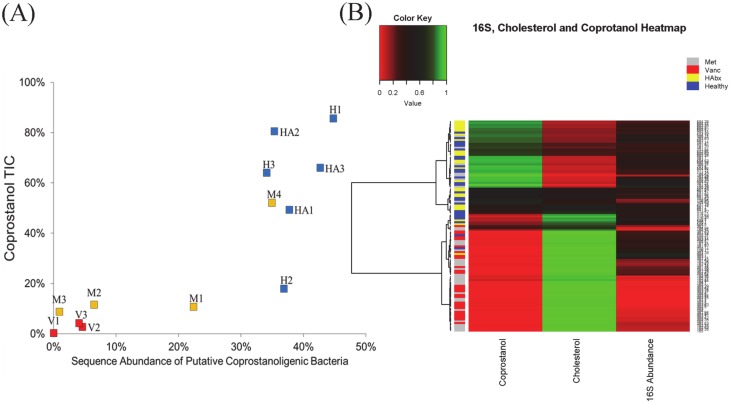
Fig 5. Relationship between the abundance of coprostanol-associated bacteria and coprostanol levels for each subject.
(A) The mean abundance of coprostanol-associated bacteria for all samples within each subject is shown in x-axis. The mean proportion of coprostanol relative to the sum of cholesterol and coprostanol in TIC (total ion current) is shown on the y-axis. Both an exponential and a linear model fit well to the correlation between coprostanol TIC and 16S rRNA sequence abundance (see Results section). H: Healthy volunteers without prior antibiotic use, HA: Healthy volunteers with prior antibiotic exposure, M: Subjects with CDI who received metronidazole therapy, and V: subjects with CDI who received oral vancomycin therapy (V). (B): Hierarchical clustering of all samples using Ward’s clustering on a Manhattan distance matrix. Each row indicates a sample, color-coded according to cohort: HAbx (yellow), Healthy (blue), Metronidazole group (gray), and Vancomycin group (red). The abundance of coprostanol, cholesterol TIC, and 16S rRNA sequence reads that mapped to coprostanol-associated bacteria for each sample is shown per each column.

