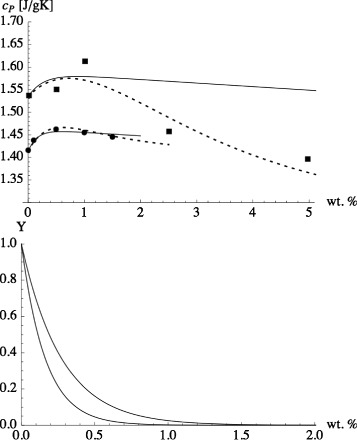
Fig. 6.

Refined interacting mesolayer model compared to the experiment. Top: Equation 16 (solid lines) compared to the experiments of Lasfargues et al. [32] (solid circles) and Heilmann [33] (solid squares) from Fig. 3 (bottom panel). We use the experimental liquid densities of the respective source - even though the base salt is the same in both cases. Here, κ=1.035 as in Fig. 4. Δ/R=10 in the case of the Lasfargues et al. data and Δ/R=8 in the case of the Heilmann data. In addition, we use ρ liquid=1.8 g/cm 3, g/cm 3, ρ alumina=3.6 g/cm 3, and c P,np between 0.7 and 0.8 J/(gK). Dashed lines: Variable κ as explained in the text. Bottom: Y vs. weight percent corresponding to the two solid lines above. The lower (upper) curve corresponds to the fit of the Lasfargues (Heilmann) data
