Abstract
In the context of a secondary ion mass spectrometry (SIMS) experiment, dynamic reactive ionization (DRI) involves introducing a reactive dopant, HCl, into an Ar gas cluster primary ion beam along with a source of water to enable dissociation of HCl to free protons. This concerted effect, precisely occurring at the impact site of the cluster beam, enhances the protonation of molecular species. Here, the authors apply this methodology to study the hippocampus and cerebellum region of a frozen-hydrated mouse brain section. To determine the degree of enhancement associated with DRI conditions, sequential tissue slices were arranged in a mirrored configuration so that comparable regions of the tissue could be explored. The results show that the protonated lipid species are increased by ∼10-fold, but that the normally prevalent salt adducts are virtually unaffected. This observation is discussed as a novel approach to minimizing SIMS matrix effects in complex materials. Moreover, the chemical images of protonated lipid ions exhibit clearer features in the cerebellum region as compared to images acquired with the pure Ar cluster beam.
I. INTRODUCTION
Bioimaging with cluster-based secondary ion mass spectrometry (SIMS) has proven to be highly successful due in part to the reduced fragmentation of biomolecules relative to atomic ion projectiles.1 The emergence of gas cluster ion beams (GCIBs) such as Arn+ (n = 1000–10 000) has further expanded the repertoire of molecules amenable for study. Several critical difficulties remain to be addressed before the full capabilities of this approach can be realized. Although molecular fragmentation is greatly reduced as the cluster size increases, the ionization probability of the target molecule often is observed to decrease.2 Since sensitivity is a critical element of bioimaging with SIMS, this effect is a serious drawback. Moreover, matrix effects3,4 related to proton transfer processes that occur during [M + H]+ formation and salt suppression5 are often difficult to control in the complex environment of a biological sample. It is important to control these issues, particularly since GCIB's appear to be focusable to a <1 μm spot, opening the possibility of direct imaging with these probes.
To rectify the ionization probability issue, a number of novel approaches have been put forth. The Vickerman laboratory has developed an ion source based upon water clusters with the idea of bringing H-atoms or protons directly to the site of ionization. They have shown orders of magnitude improvement in ionization efficiency as well as reduced matrix effects associated with proton transfer processes.6 Other types of projectiles have been examined with varying degrees of success. Our strategy is to utilize Ar GCIB's mixed with a low concentration of reactive small molecules, inducing chemical ionization directly at the point of impact of the projectile. Doping Ar2000 with 5% CH4, for example, increases the molecular ion yield of a variety of biomolecules by ∼4×.7 We have also found that providing the optimal chemical environment at the sample surface can be beneficial. When mixing HCl with the Ar GCIB, only a small increase in the protonated molecular ion is observed, presumably because there is not enough kinetic energy per atom to break the H–Cl bond. When water in the form of ice is present at the sample surface, however, the HCl can be enticed to dissociate into H3O+ and Cl− for direct ionization of target molecules. When combining these three ingredients, there are enough protons produced at the impact site to increase the ionization efficiency by ∼10×. This protocol has been referred to as dynamic reactive ionization (DRI). Moreover, when employing trehalose as a model system, only the protonated molecular ions are observed to be enhanced, while the ionization due to salt adducts is unaffected.7
Tissue imaging with SIMS has allowed the distribution of various lipid species to be visualized in healthy and diseased samples, yielding insight into lipid related disease progression. Localization of drug molecules in tissue would be another important goal aimed to assist in understanding the mechanism of drug action and to provide guidance in drug development.8–13 All of these studies require high ion yields from multiple species originating from complex biological samples, especially since critical components may be present in low concentrations and may be subject to significant matrix effects. To test the efficacy of chemically reactive GCIBs with tissue, a comparison of images acquired using 20 keV (H2O)4000+ and 20 keV Ar6000+ has recently been reported. These results show that the protonated molecular ions of various lipids are increased by 10–100× and that the salt adducts of the lipid species are equally enhanced. These results provide real encouragement for the use of reactive GCIBs in direct imaging of tissue samples.14
In this work, we compare SIMS images from mouse-brain tissue acquired using Ar1500+ to those obtained using 5% HCl doped Ar1500+ without and with a D2O ice overlay on the sample. The latter case is an example of the DRI process discussed above. To achieve a meaningful comparison, two sequential brain slices were displayed side by side. Using this type of mirroring, the results show that protonated lipid signals are enhanced by up to tenfold under DRI conditions, but that the salt adducts are largely unaffected. Hence, this approach allows both higher sensitivity and reduced matrix effects—an important step in tissue imaging with GCIBs.
II. EXPERIMENT
A. Sample preparation, mirror tissue sectioning
The mouse brain was obtained from Rockland antibodies and assays, which has already been cryopreserved with compliance to the ethically approved procedure. To avoid variation between different slices, two sequential sections of thickness 5 μm were prepared using a Cryostat Leica CM1950 (Leica) (Life science, Pennsylvania State University). Both slices were mounted on a copper plate inside the microtome and rapidly quenched into liquid nitrogen. Before mounting, the second slice was flipped by 180° to ensure that both slices were acquired from the same depth into the brain. The samples were kept in liquid nitrogen before being transferred to the precooled sample stage of the SIMS instrument. Imaging was acquired directly from these frozen-hydrated samples at 110 K.
B. SIMS analysis
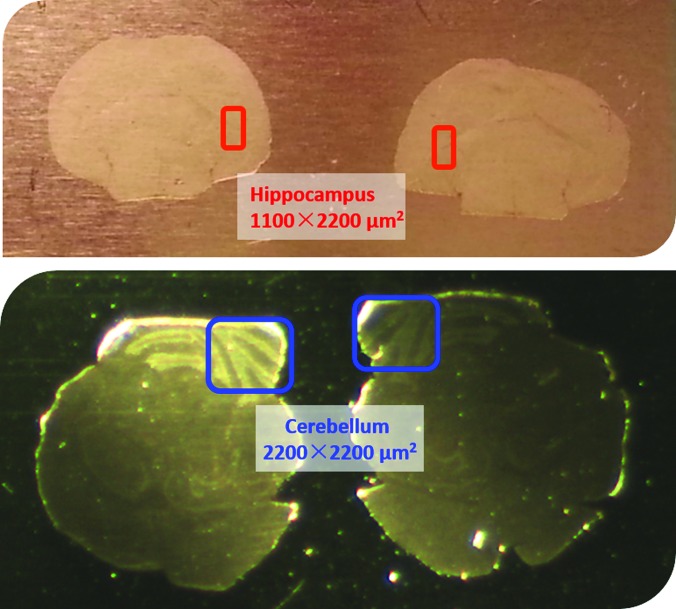
The SIMS analyses were performed with the J105 3D Chemical Imager (Ionoptika, UK) as described previously.15 The experiments utilized primarily two different ion beams consisting of either 20 keV Ar1500 + or 20 keV HCl doped Ar1500 + clusters, which were produced using a GCIB source from Ionoptika. The procedure of mixing HCl into Ar cluster is detailed elsewhere.7 The cluster size distribution was centered around 1500 with a width of ±500 constituents. The same areas from the mirrored slices were imaged using pure Ar1500+ and the Ar1500+ (5% HCl) beam, respectively. When imaging with the Ar1500+ (5% HCl) beam, D2O was leaked into the analysis chamber at a partial pressure of 5 × 10⁻⁷ mbar for 1 min. D2O ice of ∼10 nm was estimated to be condensed onto the tissue surface. Two different areas of the brain were examined in detail, as shown in Fig. 1. In the hippocampus region, depth profiling was performed so as to directly compare signal intensity resulting from the various beams. In the cerebellum region, one slice of the mirrored pair was interrogated using the pure Ar1500+ beam. The other mirrored slice was studied using Ar1500+ (5% HCl) with and without the D2O ice overlayer.
Fig. 1.
Mirror slices of mouse brain tissue. The highlighted area in the top pair tissues are hippocampus around 1100 × 2200 μm2, being analyzed at different conditions, pure Ar1500+, and Ar1500+(5% HCl) with D2O ice overlayer on the sample to compare the ion yields of protonated lipids species. The highlighted cerebellum areas in the bottom pair are 1100 × 2200 μm2, being analyzed using pure Ar1500+, and Ar1500+(5% HCl) without and with D2O ice overlayer on the sample to assess the image qualities.
III. RESULTS AND DISCUSSION
A. Signal enhancement using the Ar1500+ (5% HCl) beam with a D2O ice overlayer
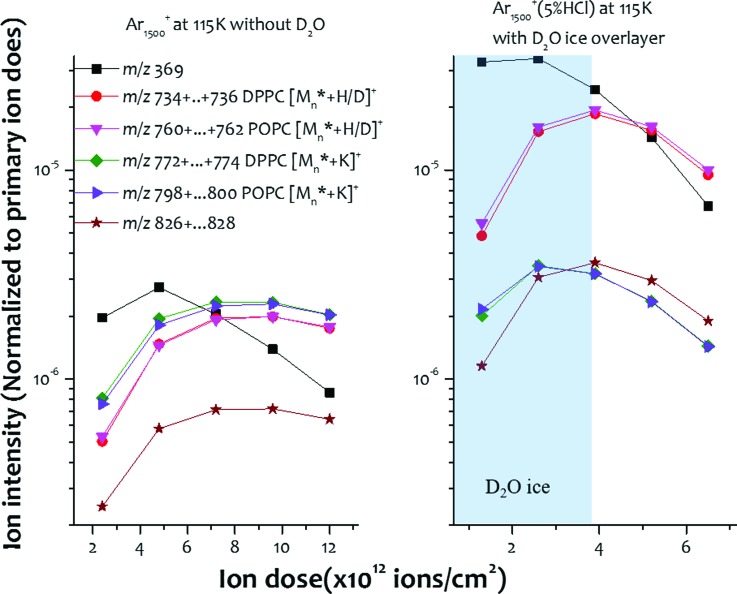
In the hippocampus, the distribution of phospholipids such as dipalmitoylphosphatidylcholine (DPPC) and palmitoyloleoylphosphatidylcholine (POPC) are uniformly distributed throughout the area. Hence, this region is well-suited for comparing SIMS spectra acquired from the two mirror slices under different conditions. These comparisons are shown in Fig. 2, where the response of the tissue to bombardment of pure Ar1500+ clusters versus HCl doped Ar1500+ with D2O water condensation are shown as a function of primary ion dose.
Fig. 2.
Ion yields of several lipids species from hipocampus areas of mirror slices using pure Ar1500+, and Ar1500+(5% HCl) with D2O ice overlayer on the sample along with the primary ion dose. The monitored ions are in the form of pronated ions and sodiated ions. Mn* is used to describe the one H/D exchange in the molecules.
When the D2O ice layer is present on the tissue surface, the deuterated molecular ion and H/D exchange induced ions from different lipid species are observed. For example, the DPPC forms [M + H]+ at m/z 734, [M + D]+ or [M1* + H]+ (M1* is used to describe one H/D exchange in the molecule) at m/z 735, and [M2* + H]+ or [M1* + D]+ at m/z 736. For the purposes of display in Fig. 2, all the [Mn* + H/D]+ ions are summed together to determine the molecular ion intensity. Depth profiling using the pure Ar1500+ cluster as shown in Fig. 2(a) illustrates how the ion intensity (normalized to primary ion dose) initially increases before reaching a steady state after a dose of about 6 × 10¹² ions/cm2. For the HCl doped Ar1500+ with D2O ice overlayer shown in Fig. 2(b), however, the situation is more complicated. For this case, the molecular ion intensity reaches a maximum value at the interfacial region defined by the ice layer and the tissue surface. The maximum at the interface presumably arises since in this region, there is maximum spatial overlap between the protons from the HCl and the D2O layer and the molecules at the tissue surface. Note that the protonated molecular ion family of DPPC and POPC increase by ∼10 fold, while the potassiated ion family of DPPC and POPC are nearly the same for both projectiles. From this observation, it is clear that the unknown ion at m/z 826 is a lipid molecular ion since this ion family is increased by tenfold as well. The cholesterol ion [M + H-H2O]+ at m/z 369 also increases by an order of magnitude since DRI not only enhances the [M + H]+ ion, but [M + H-H2O]+ as well.16
B. Necessity of a water layer on the tissue sample surface
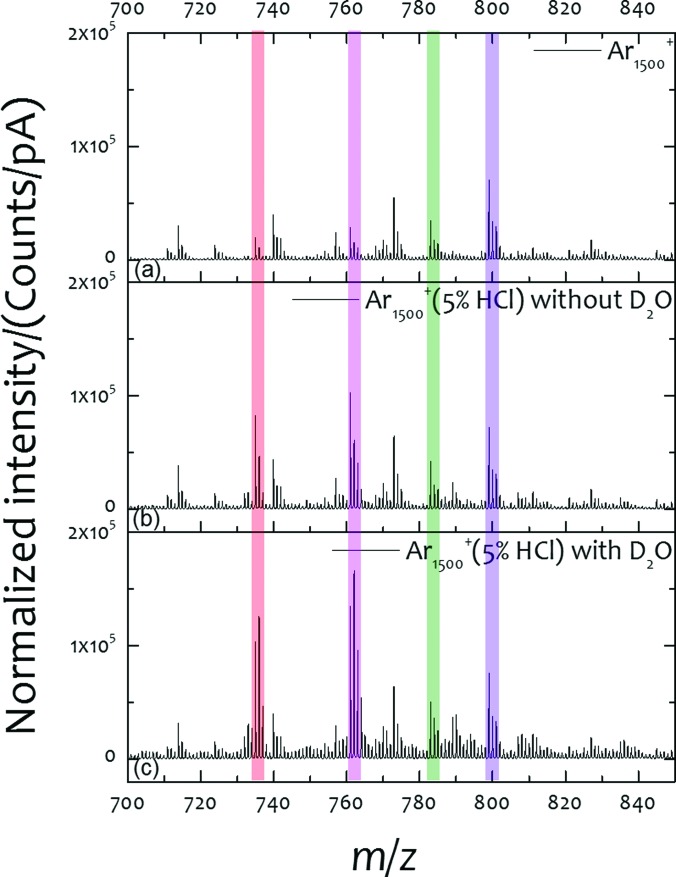
Since the tissues are characterized in the frozen-hydrated state, it is possible that the water matrix associated with the tissue provides a favorable environment for HCl dissociation without the need for extra water dosing. To test this notion, the SIMS spectra in the range of m/z 700–850 were compared for each of the three analysis conditions: pure Ar1500+, and the Ar1500+ (5% HCl) beam with and without the D2O ice coating. The positive ion spectra are shown in Fig. 3, with four highlighted mass windows for DPPC in red, POPC in pink, and their potassiated ions in green and purple, respectively. The normalized ion intensity for each of these mass windows is shown in Table I.
Fig. 3.
Positive spectra from cerebellum area from mirror slices analyzed at different experiment conditions, pure Ar1500+, and 5% HCl doped Ar1500+ without and with D2O ice overlayer on the sample.
Table I.
Comparasion of ion intensity of monitored lipids species analyzed at different experiment conditions, pure Ar1500+, and Ar1500+ (5% HCl) without and with D2O ice overlayer on the sample.
| (a) | (b) | (c) | |
|---|---|---|---|
| DPPC [Mn*+H/D]+ | 1 | 4.1 | 9.2 |
| POPC [Mn*+H/D]+ | 1 | 3.3 | 7.0 |
| DPPC [Mn*+K]+ | 1 | 1.3 | 1.3 |
| POPC [Mn*+K]+ | 1 | 1.1 | 1.1 |
The spectra illustrate a number of important points. First, note that the potassiated DPPC m/z 771 and POPC m/z 798 shown in Fig. 3(a) exhibit the highest intensity. Similarly, the sodiated POPC ion at m/z 782 is especially strong. With the Ar1500+ (5% HCl) beam, the intensity of the protonated lipid ions such as DPPC at m/z 734 and POPC at m/z 760 are greater than the potassiated species, as shown in Fig. 3(b). When D2O is deposited on the tissue surface, the protonated DPPC and POPC ions are increased further as shown in Fig. 3(c). The observed change in the isotope patterns for the protonated lipids is, of course, due to H/D exchange processes. In contrast, the isotopic peaks at m/z 773 and m/z 799 for potassiated DPPC and POPC at m/z 772 and 798 do not exhibit a significant intensity change. Based upon this observation, the low intensity ions at m/z 806, 810, and 834 may be assigned to protonated lipid species since their isotopic peaks at m/z 807, 811, and 834 are elevated using the Ar1500+ (5% HCl) beam and D2O ice coating, as shown in Fig. 3(c). These ions are not reported or assigned in the literature since salt suppression inhibits molecular ion formation.
The relative ion intensities of the key molecules interrogated by the three different circumstances are shown in Table I. Note that DPPC is enhanced by ∼4-fold when the Ar GCIB is doped with HCl, and that the enhancement increases to 9.2× when the D2O layer is added. This observation indicates that extra D2O water on the tissue surface promotes the dissociation of HCl to generate free protons directly, while water content in the tissue is mainly underneath the cell membrane, hindering the production of free protons. To our surprise, the salt adducts, and potassiated DPPC and POPC ions are at the same level under all three analysis conditions. Hence, DRI provides an environment which indirectly minimizes matrix effects in complicated biological tissue and assists in the identification of protonated lipids. These results are in contrast to observations using (H2O)6000+ beam,17 where the protonated lipid species are reported to be enhanced by 26-fold, and the potassiated lipids species are enhanced by 13-fold compared with Ar2000+ cluster imaging. This result suggests that there may be several mechanism in play that are needed to fully explain these observations.
C. Image enhancement using the Ar1500+(5% HCl) beam with D2O ice overlayer
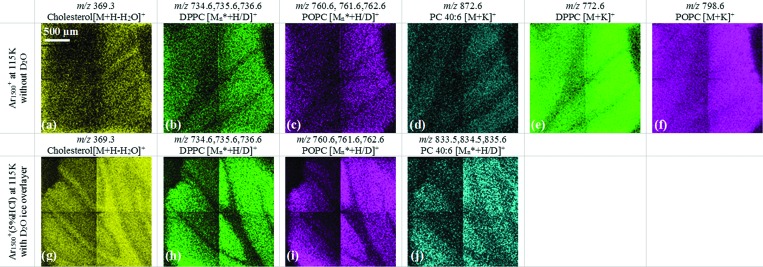
An important goal of this work is to determine whether DRI conditions can be directly applied to improving imaging of biological tissue. Preliminary observations from the mirrored mouse brain section and the cerebellum region are shown in Fig. 4. The 2 × 2 tiled images of selected lipid ions of two mirror slices using pure Ar1500+ in the top row and Ar1500+(5% HCl) beam with D2O ice overlayer in the bottom row are shown. It is clear that cholesterol, and the protonated ion family of DPPC and POPC in Figs. 4(a), 4(b) and 4(c) exhibit poor contrast using pure Ar1500+, while the image from same ions using Ar1500+(5% HCl) with D2O show clearer features as in Figs. 4(g)–4(i). Cholesterol is rich in the white matter region but is also spread into the whole cerebellum area, as shown in Fig. 4(g). Protonated ions from DPPC and POPC are mainly in the gray matter region, which are antilocalized with cholesterol as shown in Figs. 4(h) and 4(i). In contrast, the same ion images shown in Figs. 4(b) and 4(c) generated by pure Ar1500+ show poor contrast at the intersection of white matter and gray matter, possibly due to the lower intensity. The salt adduct of these ions usually are more intense using pure Ar1500+; however, the image of potassiated DPPC as shown in Fig. 4(e) exhibits the absence of this ion in the white matter region with no clear junction between white matter and gray matter. Moreover, the potassiated POPC, as shown in Fig. 4(f), is distributed over the entire cerebellum region. Another lipid GPCho 40:6 is detected as the potassiated ion using pure Ar1500+ as in shown Fig. 4(d). It is abundant in the granular layer within the cerebellum, while its protonated ion family can be imaged as in Fig. 4(i) using Ar1500+(5% HCl) beam with D2O ice layer.
Fig. 4.
Selected ion images from cerebellum area from mirror slices at different experiment conditions, pure Ar1500+, and Ar1500+ (5% HCl) with D2O ice overlayer on the sample.
IV. SUMMARY AND OUTLOOK
Here, we have utilized SIMS imaging under DRI conditions to see if this approach can be applied to characterizing complex biomaterials such as a mouse brain tissue slice. The lipid signal and distribution of major lipids from mirror slices of the tissue are compared with pure Ar1500+. The results indicate that this methodology not only significantly enhances the protonation of lipid ions but also leaves the corresponding salt ions of the lipid unaffected. Hence, there is more signal of protonated species relative to salt adducts which, in effect, reduces matrix effects associated with highly salted biosamples. The elevated protonated ions from all the lipid species facilitate the chemically mapping of lipid distribution in the cerebellum region resulting in higher contrast. The evaluation also suggests that the water-ice layer over the sample surface provides an extra boost to the protonation of intact lipid ions.
The methodology utilizes the Ar cluster beam to precisely deliver the reactive molecule HCl to the impact site, coincident with the water-ice layer which provides a favorable environment for the dissociation of HCl to generate free protons. The HCl molecule and water ice overlayer on top of the sample exhibit no interference with the biological samples, which are best studied in their frozen-hydrated state to minimize the possibility of artifacts associated with freeze-drying. We believe the approach opens new possibilities to minimize matrix effects in complicated biosamples without complicated sample preparation. For future prospects as the GCIB technology improves, we anticipate that the method can be stretched to the single cell level and to locate low concentrations of drug molecules within these cells, greatly expanding the options for imaging SIMS experiments.
ACKNOWLEDGMENTS
This study was financially supported by the National Institutes of Health (Grant No. 9R01 GM113746-20A1) and Novartis Pharmaceuticals. Infrastructure support from the Department of Energy (Grant No. DE-FG02-06ER15803) is also acknowledged.
References
- 1. Mahoney C. M., Mass Spectrom. Rev. 29, 247 (2010). 10.1002/mas.20233 [DOI] [PubMed] [Google Scholar]
- 2. Winograd N., Anal. Chem. 77, 142a (2005). 10.1021/ac053355f [DOI] [PubMed] [Google Scholar]
- 3. Shard A. G., Spencer S. J., Smith S. A., Havelund R., and Gilmore I. S., Int. J. Mass Spectrom. 377, 599 (2015). 10.1016/j.ijms.2014.06.027 [DOI] [Google Scholar]
- 4. Keskin S., Piwowar A., Hue J., Shen K., and Winograd N., Surf. Interface Anal. 45, 244 (2013). 10.1002/sia.4900 [DOI] [PMC free article] [PubMed] [Google Scholar]
- 5. Lu C., Wucher A., and Winograd N., Surf. Interface Anal. 43, 99 (2011). 10.1002/sia.3449 [DOI] [PMC free article] [PubMed] [Google Scholar]
- 6. Sheraz née Rabbani S., Barber A., Fletcher J. S., Lockyer N. P., and Vickerman J. C., Anal. Chem. 85, 5654 (2013). 10.1021/ac4013732 [DOI] [PMC free article] [PubMed] [Google Scholar]
- 7. Wucher A., Tian H., and Winograd N., Rapid Commun. Mass Spectrom. 28, 396 (2014). 10.1002/rcm.6793 [DOI] [PMC free article] [PubMed] [Google Scholar]
- 8. Sjovall P., Lausmaa J., and Johansson B., Anal. Chem. 76, 4271 (2004). 10.1021/ac049389p [DOI] [PubMed] [Google Scholar]
- 9. Brulet M., Seyer A., Edelman A., Brunelle A., Fritsch J., Ollero M., and Laprevote O., J. Lipid Res. 51, 3034 (2010). 10.1194/jlr.M008870 [DOI] [PMC free article] [PubMed] [Google Scholar]
- 10. Pernber Z., Richter K., Mansson J. E., and Nygren H., BBA-Mol. Cell Biol. Lipids 1771, 202 (2007). 10.1016/j.bbalip.2006.12.007 [DOI] [PubMed] [Google Scholar]
- 11. Malmberg P., Nygren H., Richter K., Chen Y., Dangardt F., Friberg P., and Magnusson Y., Microsc. Res. Tech. 70, 828 (2007). 10.1002/jemt.20481 [DOI] [PubMed] [Google Scholar]
- 12. Lazar A. N. et al. , Acta Neuropathol. 125, 133 (2013). 10.1007/s00401-012-1041-1 [DOI] [PubMed] [Google Scholar]
- 13. Tahallah N., Brunelle A., De La Porte S., and Laprevote O., J. Lipid Res. 49, 438 (2008). 10.1194/jlr.M700421-JLR200 [DOI] [PMC free article] [PubMed] [Google Scholar]
- 14. Rabbani S. S. N., Razo I. B., Kohn T., Lockyer N. P., and Vickerman J. C., Anal. Chem. 87, 2367 (2015). 10.1021/ac504191m [DOI] [PubMed] [Google Scholar]
- 15. Vickerman J. C., Rabbani S., Fletcher J. S., and Lockyer N. P., Surf. Interface Anal. 43, 380 (2011). 10.1002/sia.3457 [DOI] [Google Scholar]
- 16. Tian H., Wucher A., and Winograd N., J. Am. Soc. Mass Spectrom. 27, 285 (2015). 10.1007/s13361-015-1283-y [DOI] [PMC free article] [PubMed] [Google Scholar]
- 17. Berrueta Razo I., Sheraz S. N. R., Henderson A., Lockyer N. P., and Vickerman J. C., Rapid Commun. Mass Spectrom. 29, 1851 (2015). 10.1002/rcm.7285 [DOI] [PMC free article] [PubMed] [Google Scholar]


