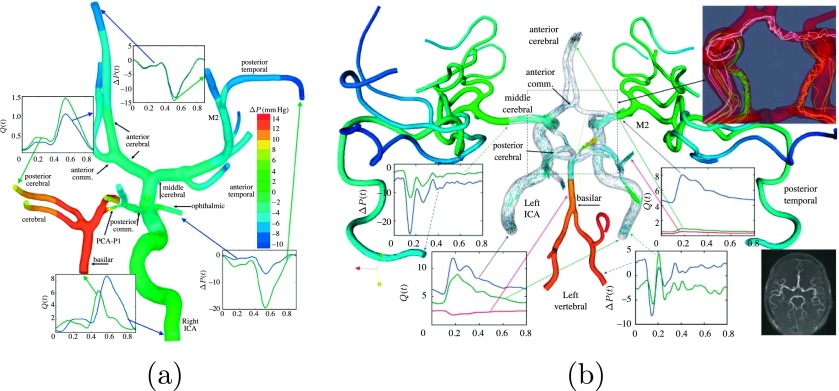
FIG. 1.
Simulation of the human intracranial arterial tree: (a) Brain blood flow simulation in an incomplete CoW of a patient with hydrocephalus: geometrical model of 23 cranial arteries.6 (b) Brain blood flow simulation in complete CoW: geometrical model of 65 cranial arteries.6 Colors represent pressure, arrows represent velocity fields, plots depict the flow rate in ml/s and pressure drop in mm Hg, where the reference pressure is the average pressure at the internal carotid artery (inlet). Top right: instantaneous streamlines showing complex swirling flow in communicating arteries. Bottom right: MRA image of the cranial arterial system. Reprinted with permission from Grinberg et al., “Simulation of the human intracranial arterial tree,” Philos. Trans. R. Soc., A 367, 2371–2386 (2009). Copyright 2009 Royal Society Publishing.

