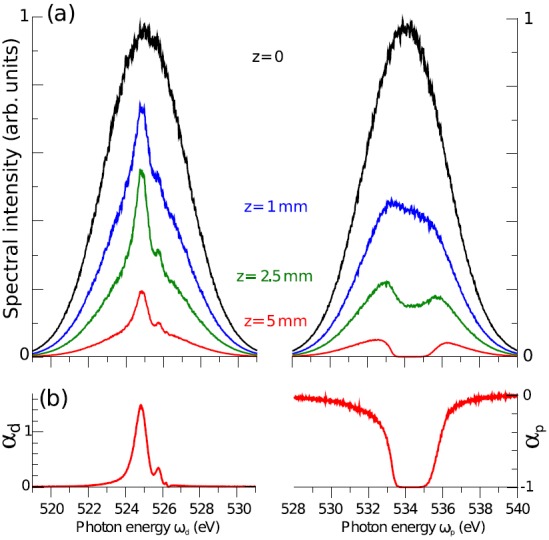
FIG. 2.

(a) Dependence of the pump (right) and dump (left) spectra on propagation length for the strong pump regime ( photons per pulse, pulse duration is 100 fs). The spectral profiles at various propagation distances z are averaged over 4000 individual SASE shots. The spectra are normalized to the maximum of the incoming intensities. (b) Relative change in spectral intensity at z = 5 mm for the dump ωd (left) and pump ωp (right) field, respectively.
