
FIG. 5.
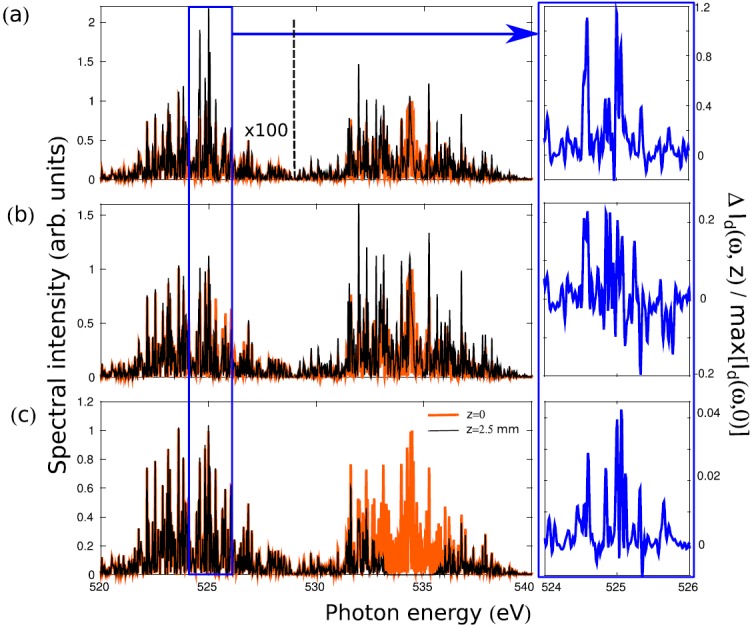
Two-color SASE spectra at z = 0 (thick orange lines) and z = 2.5 mm (thin black lines) propagating distance in the CO medium; we corrected for the off-resonant absorption and all the spectra are normalized to the maximal peak intensity at z = 0. The calculations use the same SASE spectral profile renormalized to the specific number of incoming photons: (a) photons and photons, (b) , and (c) photons. The right panels show the spectral difference of the incoming and outgoing pulses normalized to the maximal peak intensity at z = 0.