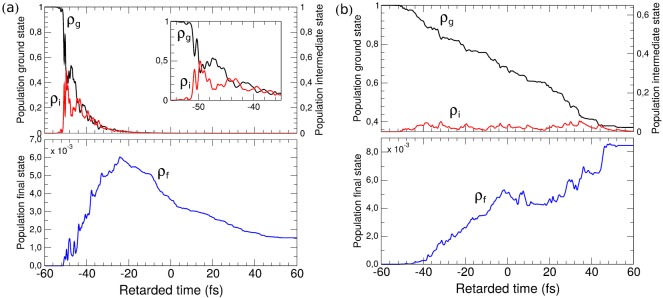
FIG. 6.
Populations at z = 0 for the strong pump regime (a) and weak pump regime (b). Black, red, and blue lines are the total populations of the ground ρg, core-excited ρi, and final ρf electronic states, respectively; the retarded time scale (measured relative to the center of the pump pulse) is used. The inset in plot (a) shows a zoom of the populations dynamics at the beginning of the pump pulse illustrating the fast Rabi oscillation with the period of fs.

