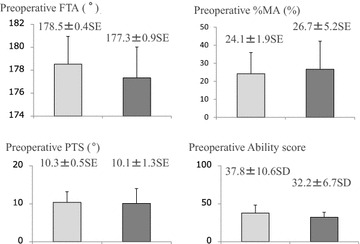
Fig. 4.

Comparing the patients’ preoperative characteristics, the BMI value is markedly higher in the Late Cured group than in the Early Cured group (Student’s t test P = 0.031). There are no other significant differences between the two groups

Comparing the patients’ preoperative characteristics, the BMI value is markedly higher in the Late Cured group than in the Early Cured group (Student’s t test P = 0.031). There are no other significant differences between the two groups