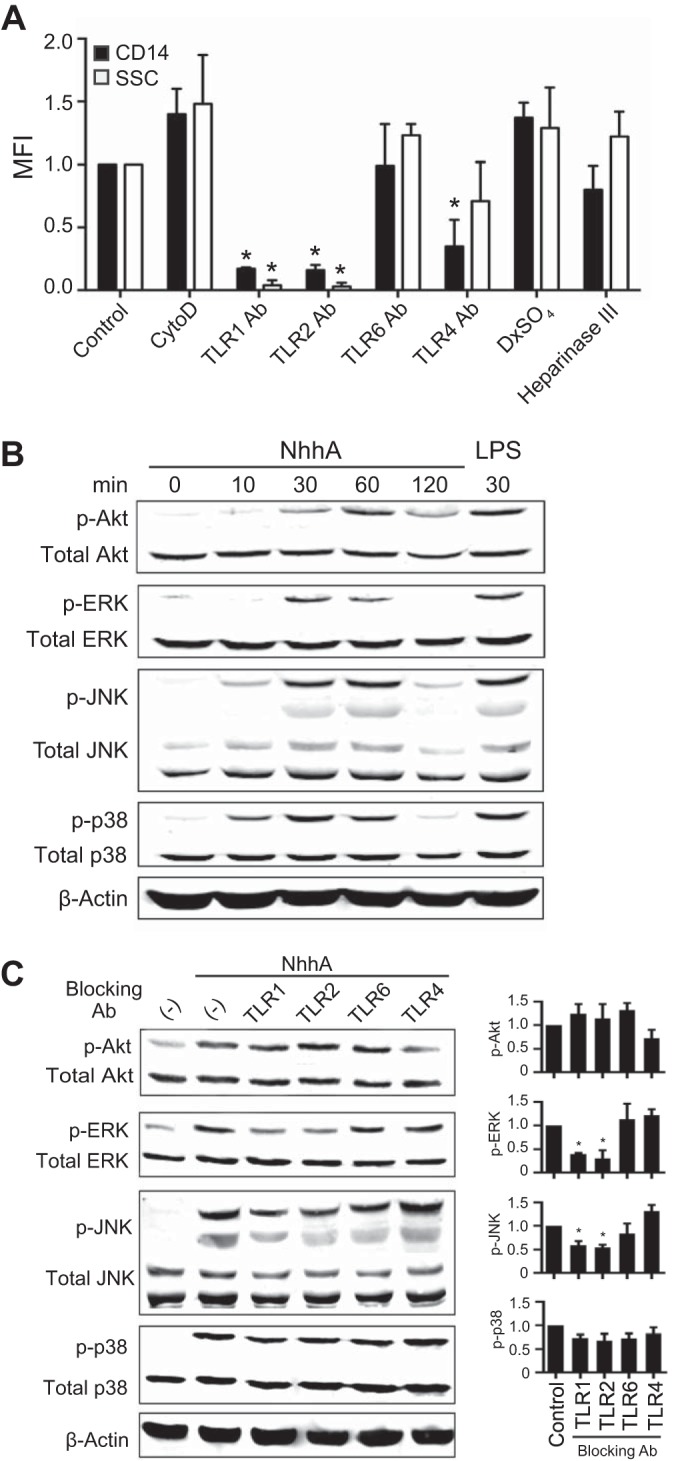
FIG 2 .

NhhA-triggered Mo differentiation is dependent on TLR1/TLR2 activation. (A) Mo were treated with 50 nM NhhA alone (control) or in the presence of cytochalasin D (1 µM; actin polymerization inhibitor), dextran sulfate (100 µg/ml; scavenger receptor antagonist), heparinase III (5 U/ml), or blocking antibodies (Abs) directed against human TLR1, TLR2, TLR4, and TLR6 (5 µg/ml) for 3 days. Differentiation to Mφ was determined by the flow cytometric analysis of CD14 expression and SSC parameters (shown as median fluorescence intensity [MFI]) and presented as fold change relative to the control. Error bars indicate medians with interquartile ranges of three independent experiments. *, P < 0.05 compared with the control using ANOVA followed by the Bonferroni post hoc test. (B) Mo were treated with 50 nM NhhA for the indicated time points, and whole-cell lysates were analyzed by Western blotting to detect phosphorylation of Akt, ERK, JNK, and p38. β-Actin was stained as the loading control. Mo treated with lipopolysaccharide (LPS; 100 ng/ml) for 30 min were used as the positive control. The data shown are representative of three independent experiments. (C) Mo were treated with 50 nM NhhA alone (control) or cotreated with neutralizing antibodies directed against human TLR1, TLR2, TLR4, and TLR6 (5 µg/ml) for 30 min (ERK, JNK, and p38) to 60 min (Akt). Phosphorylation of the indicated proteins was detected by Western blotting. One representative image is shown in the left panel. Densitometric analysis of phosphoprotein normalized to the respective total protein is shown in the right panel. Data shown are the mean ± standard deviation from three independent experiments and are presented as fold change relative to control. *, P < 0.05 compared with the control using ANOVA followed by the Bonferroni post hoc test.
