
FIG 4 .
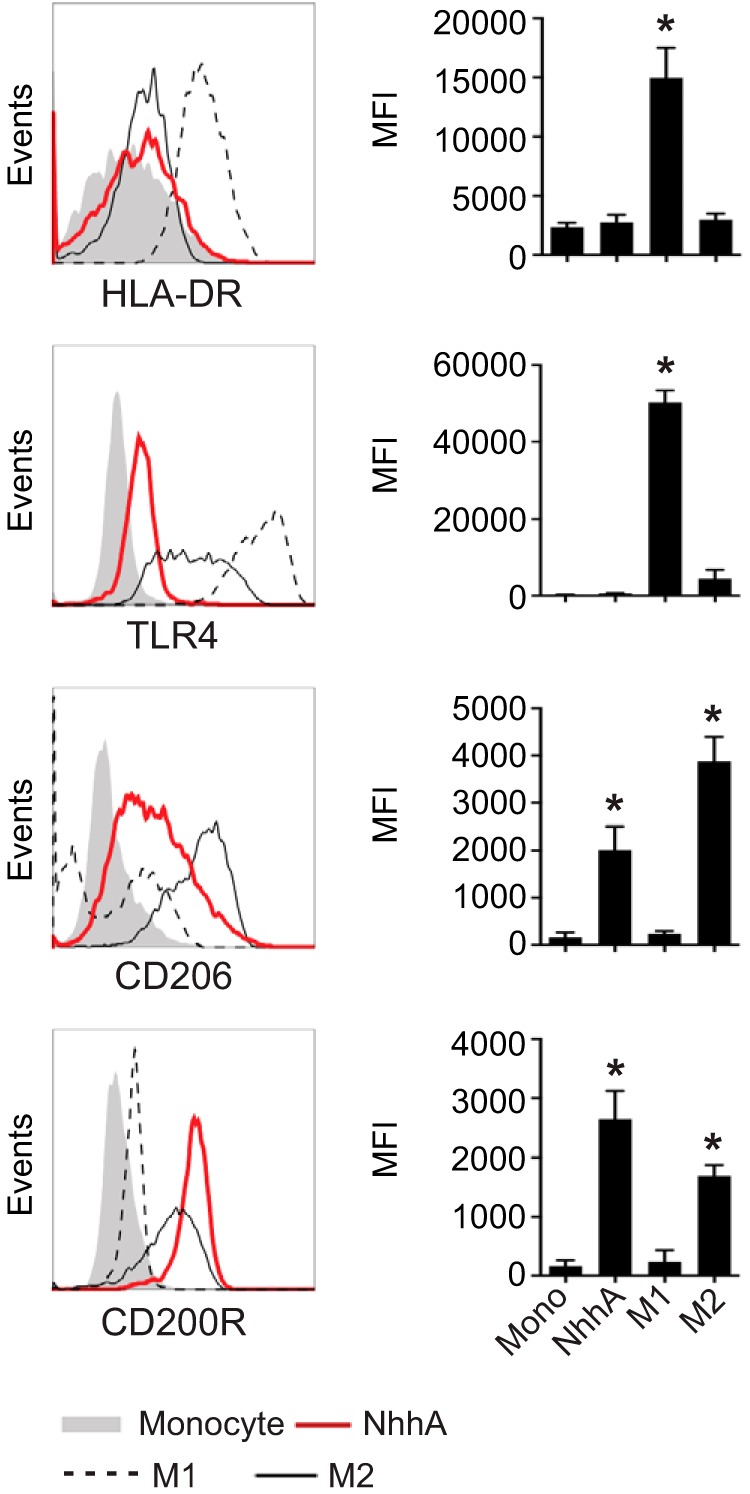
NhhA upregulates surface CD200R expression on Mφ. Mo were treated with 50 nM NhhA for 3 days. M1- or M2-polarized Mφ were generated as described in Materials and Methods. Expression of the indicated surface protein was analyzed by flow cytometry. The left panel shows fluorescence-activated cell sorting plots of one representative staining, and the median fluorescence intensities (MFIs) are shown in the right panel. Error bars indicate medians with interquartile ranges of three independent experiments. *, P < 0.05 compared with the Mo control using ANOVA followed by the Bonferroni post hoc test.