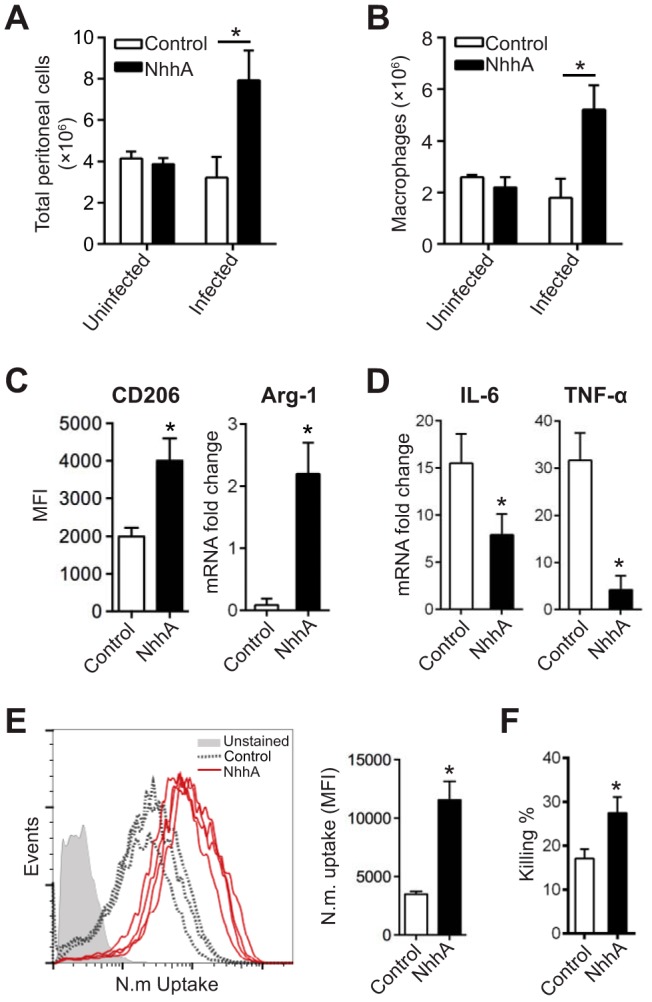
FIG 6 .

NhhA modulates phenotype polarization of macrophages in vivo. CD46+/+ mice were challenged i.p. with 50 nM native or heat-inactivated NhhA (control) for 3 days prior to infection with FAM20 (108 CFU/mouse). At 12 h postinfection, peritoneal cells were collected from both the bacterium-infected and uninfected mice. In some experiments (C to F), peritoneal cells were cultured in cell culture plates for 2 h, and attached Mφ were isolated for functional analysis. (A) The total number of peritoneal cells was quantified by trypan blue staining and presented as the mean ± standard deviation (n = 6) (*, P < 0.05 using paired Student’s t test). (B) The Mφ subset was quantified by flow cytometry by gating for F4/80hi CD11bhi Ly6Cint Ly6G− cells. Data presented are mean ± standard deviation (n = 6) (*, P < 0.05 using paired Student’s t test). (C and D) Effects of NhhA on Mφ polarization. (C) Surface expression of CD206 was quantified by flow cytometry and shown as median fluorescence intensity (MFI) with interquartile ranges (n = 6). Arg-1 mRNA was analyzed by qPCR. Error bars indicate mean ± standard deviation (n = 6). (D) TNF-α and IL-6 mRNAs were quantified by qPCR. All data from qPCR were normalized to the reference gene gapdh and are presented as fold change relative to uninfected samples. Data shown are the mean ± standard deviation (n = 6) (*, P < 0.05 using paired Student’s t test). (E and F) NhhA treatment enhances phagocytosis and bacterial elimination by peritoneal Mφ. (E) Peritoneal Mφ collected from the control (n = 3) or NhhA-treated (n = 4) mice were challenged with FITC-labeled N. meningitidis FAM20 (MOI, 100) for 40 min at 37°C. The number of intracellular bacteria was quantified by flow cytometry. The plots of bacterial uptake are presented in the left panel, and quantified data, presented as median fluorescence intensity (MFI), are shown in the right panel. Error bars indicate medians with interquartile ranges. *, P < 0.05 using paired Student’s t test. (F) Some peritoneal Mφ were treated with live FAM20 (MOI, 100) for 40 min, and bacterial elimination was determined as described in Fig. 5D. Data are presented as the mean ± standard deviation (n = 3 or 4). *, P < 0.05 compared with the control group using paired Student’s t test. Data shown in panels A to F are representative of at least three independent experiments.
