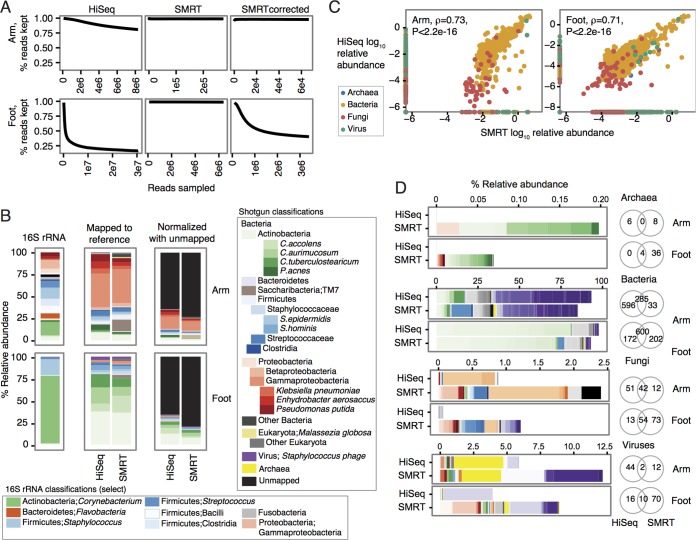
FIG 1 .
SMRT reads accurately reconstruct species abundances in metagenomic communities and recover rare species. (A) Estimation of sequencing coverage of the community. The number of reads subsampled for k-mer counting is shown as Reads sampled on the x axis. Reads are split into 20-mers, compared to a k-mer coverage table, and kept only if the median k-mer coverage is below 20× (percent reads kept shown on the y axis). If k-mer coverage is sufficiently deep for the community, one observes a decrease and leveling off in percent reads kept as the number of reads sampled increases. Whether the reads were generated with HiSeq, SMRT sequencing, or SMRT reads error corrected using HiSeq reads is indicated for each panel. (B) Relative abundance plots of the most abundant taxa per kingdom. “16S rRNA” classifications are to the genus level. “Mapped to reference” indicates relative abundances mapping to a multikingdom reference database containing Archaea, Bacteria, fungi, and viruses. “Normalized with unmapped” contextualizes the relative abundance of species generated by reference-based mapping to the fraction of reads from the sample that does not map to any reference. (C) Concordance of HiSeq and SMRT species classifications with Spearman correlation (ρ) calculated with the corresponding P value. (D) Differential detection of species with the two sequencing methods shown by kingdom. Venn diagrams show the shared number of species detected for the arm and foot samples. The colors indicate different taxonomic units for the Archaea, Bacteria, fungi, and viruses as follows. For Archaea, red colors indicate Crenarchaeota and green colors indicate Euryarchaeota. For Bacteria, red colors indicate Acidobacteria, Spirochaetes, Tenericutes, Thermotogae, and Verrucomicrobia; greens indicate Actinobacteria; blues indicate Bacteroidetes, Chlamydiae, Chloroflexi, and Cyanobacteria; oranges indicate Deinococcus-Thermus; grays indicate Firmicutes; yellows indicate Fusobacteria and Plantomycetes; purples indicate Proteobacteria. For fungi, reds, yellows, and purples indicate miscellaneous; greens indicate Apicomplexa; blues indicate Ascomycota; oranges indicate Basidiomycota; grays indicate Chlorophyta. For viruses, red and blue colors indicate miscellaneous and Fuselloviridae; greens indicate Herpesviridae; oranges indicate Myoviridae; grays indicate Papillomaviridae, Phycodnaviridae, Podoviridae, Polydnaviridae, and Polyomaviridae; yellows indicate Poxviridae; purples indicate Siphoviridae.

