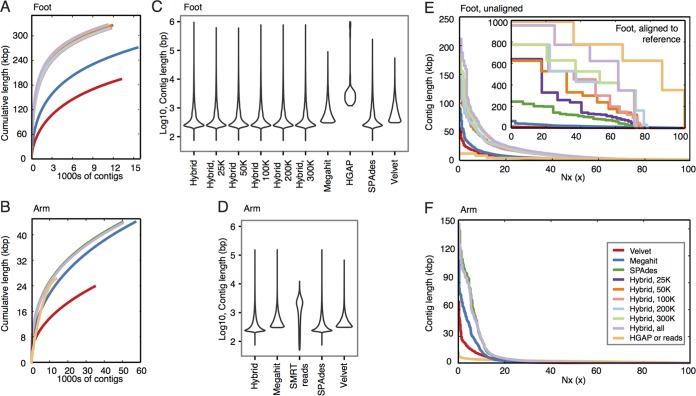
FIG 3 .
Metagenomic assembly comparisons between long-read, short-read, and hybrid approaches. (A and B) Line plots show the cumulative length of contigs generated by each of the assembly methods for the foot and arm samples, respectively. The assembly methods are indicated by the colors shown in the legend in panel F. (C and D) Violin plots are boxplots whose shapes show the density distribution of contig lengths (log10) for each of the assembly methods. (E and F) Modified Nx plots show the length for which the contigs of that length or longer covers x percentage of the assembly. For the foot, plots are separated by what aligned to the C. simulans metagenome as a reference (inset) or for contigs that did not align (unaligned). For the arm, all contigs are shown.

