
Figure 3.
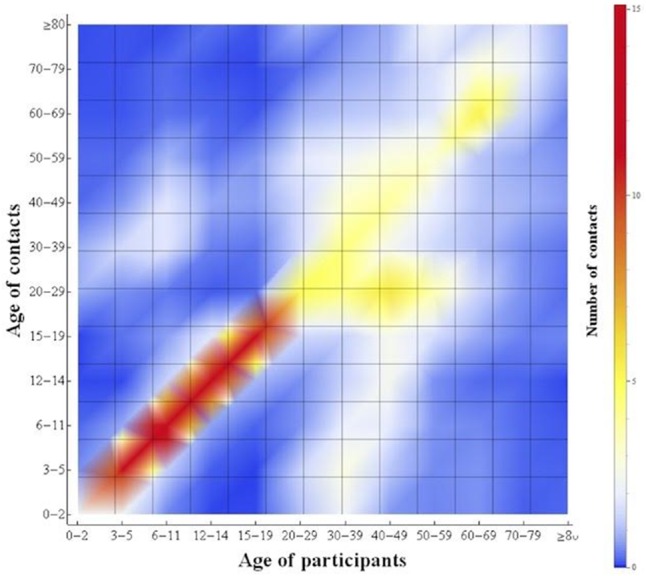
Age-specific mixing patterns between 13 age groups in Japan, based on survey data. The figure shows the reported number of contacts per day between any two age groups. Age groups (in years) are defined as: 0–2, 3–5, 6–11, 12–14, 15–19, 20–29, 30–39, 40–49, 50–59, 60–69, 70–79 and 80 years or above.