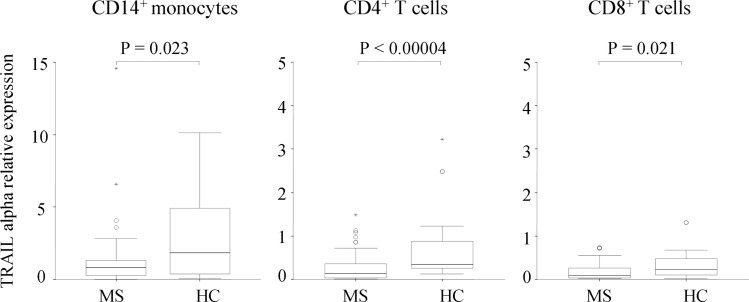
Figure 2.
The Tumour necrosis factor-Related Apoptosis Inducing Ligand (TRAIL) α differential expression in healthy controls (HC) and untreated patients with multiple sclerosis (MS). Expression levels are represented as relative expression compared with the reference gene GAPDH, using the ΔΔCt method. Figures show box plots: the horizontal bars are the median and lower and upper edges of the boxes represent the 25–75th centiles. Lines extending from the box are 10th and 90th centiles. The Mann-Whitney U test was used to determine statistical differences.

