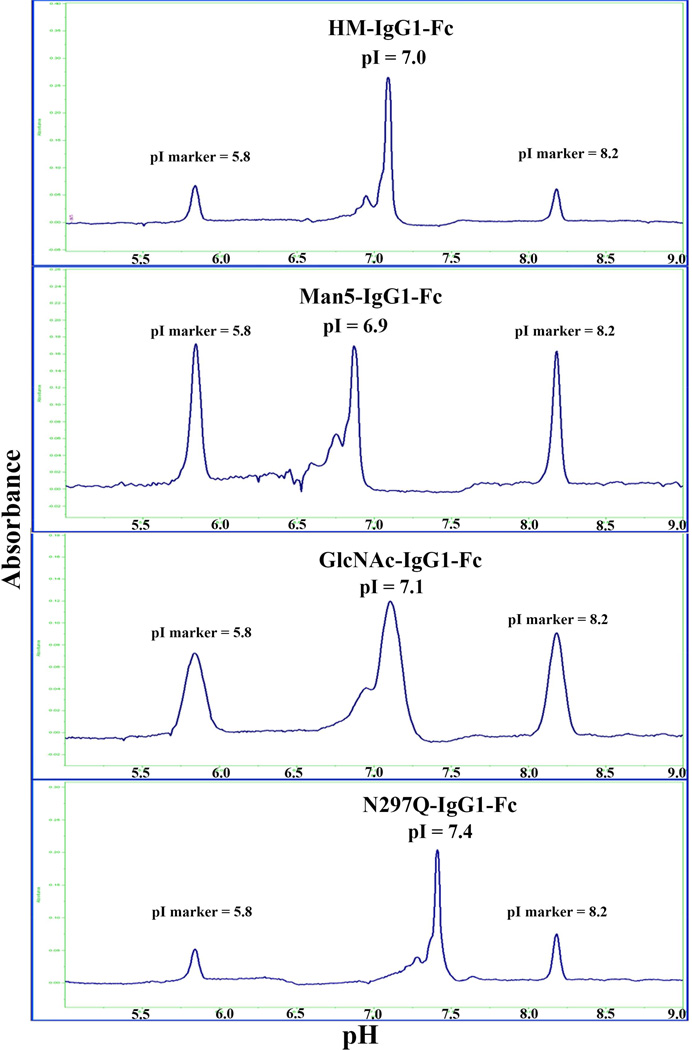
Figure 5.
Representative charge heterogeneity profiles of IgG1 Fc glycoforms as measured by capillary isoelectric focusing (cIEF). The isoelectric point (pI) of the main peak (n=3; SD ~0.1 pI units): pI of 7.0 for HM-Fc, pI of 6.9 for Man5-IgG1Fc,, pI of 7.1 for GlcNAc-Fc, and pI of 7.4 for N297Q-Fc.

