Fig. 5.

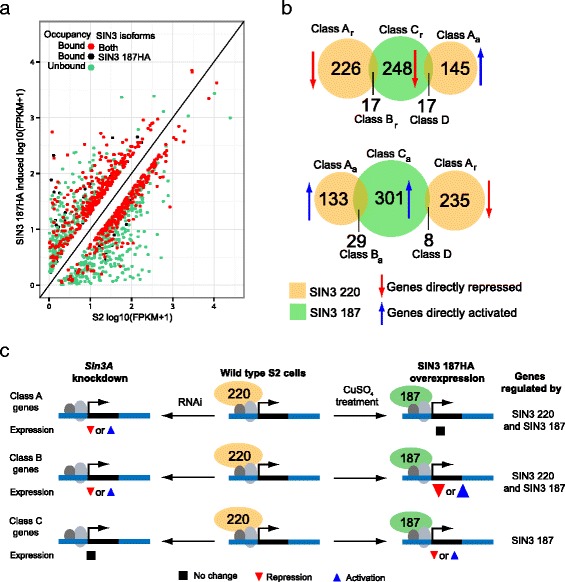
SIN3 187 regulates distinct as well as common genes as that of SIN3 220. a Scatter plots showing the correlation between genes bound and that change in expression upon overexpression of SIN3 187. Green dots denote genes regulated by SIN3 187 but not bound. Red dots indicate genes that are regulated by SIN3 187 and are bound by both SIN3 isoforms. Black dots refer to genes uniquely bound and regulated by SIN3 187. b Venn diagrams showing the comparison of genes directly regulated by SIN3 isoforms. Different classes of genes are labelled as A, B, C and D. r, repression. a, activation. c Schematic showing the regulation of Class A, B and C genes by the SIN3 isoforms. The middle column shows the genes bound by SIN3 220 in wild type cells. Gene expression upon Sin3A (SIN3 220) knockdown is depicted in the left column and gene expression upon ectopic expression of SIN3 187HA is represented in the right column
