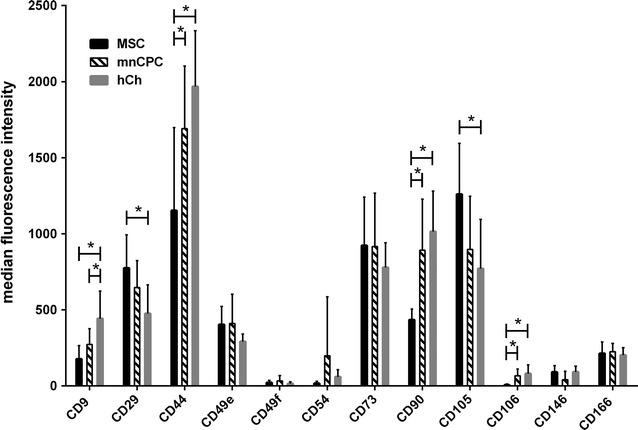
Fig. 2.

FACS analysis of surface marker expression. The expression of surface markers is given as median fluorescence intensity normalised to the respective isotype control. MSC (black n = 9), mnCPC (black and white stripes n = 10) and hCh (dark grey n = 9). *p ≤ 0.05. For determination of CD166, only 5–9 independent samples of each cell type were available
