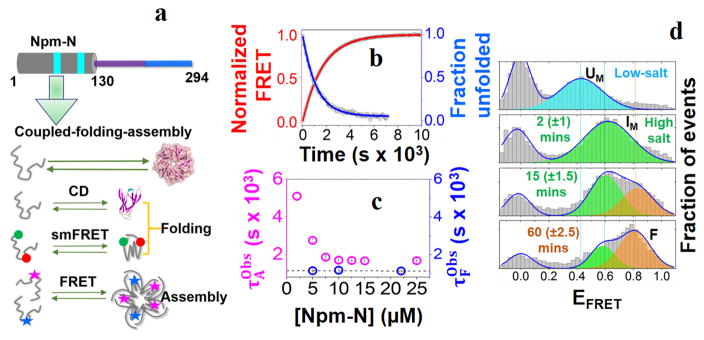
Figure 1. Folding-induced-assembly of Npm-N.
(a) Cartoon representation of the N-terminal oligomerization domain of NPM1 (Npm-N; 1–130 AAs). The cyan patches indicate two putative nuclear export signaling (NES) motifs (top). Also shown are schematics of different experimental assays that are used to study coupled folding and assembly kinetics of Npm-N (bottom). (b) Representative folding and assembly kinetic traces of Npm-N ([Npm-N] = 10 μM) at high salt (150 mM NaCl). The points are experimental data, lines are fit to appropriate models (See Methods) yielding τF = 1167±7 s, and . (c) Concentration dependence of the folding and assembly time-constants. The dotted line indicates the average value of τF. (d) smFRET histograms showing the folding pathway of Npm-N at 150 mM NaCl. The solid lines represent fitting of the experimental data to a Gaussian model. The peak at zero is due to molecules lacking an active acceptor dye. The time values in the parenthesis indicate uncertainties due to finite data acquisition time.

