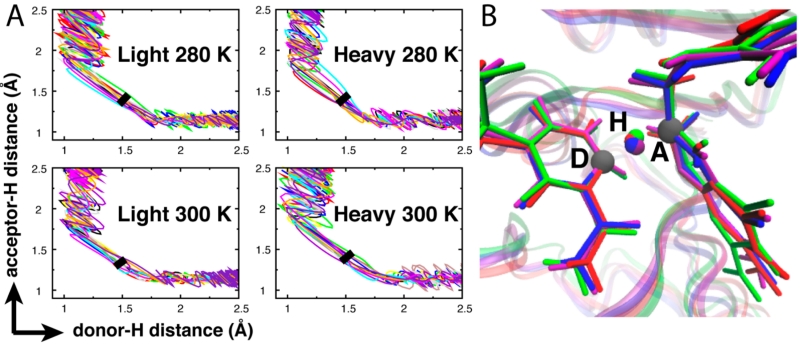
Figure 2.
Temperature and ecDHFR protein isotope effects alter subpicosecond protein dynamics (Figure S2) but not the hydride transfer TS. (A) l- and h-DHFRs show the same reactive trajectories projected on the dDH and dHA distances. The thick black line in each plot marks the TS location determined by committor analysis (Figure S1). (B) Superimposition of four representative TS structures (purple: light 280 K; red: light 300 K; blue: heavy 280 K; green: heavy 300 K) indicates the same TS geometry for l- and h-DHFRs. The TS structures shown in this figure are extracted from the reactive trajectories shown in Figure S1.

