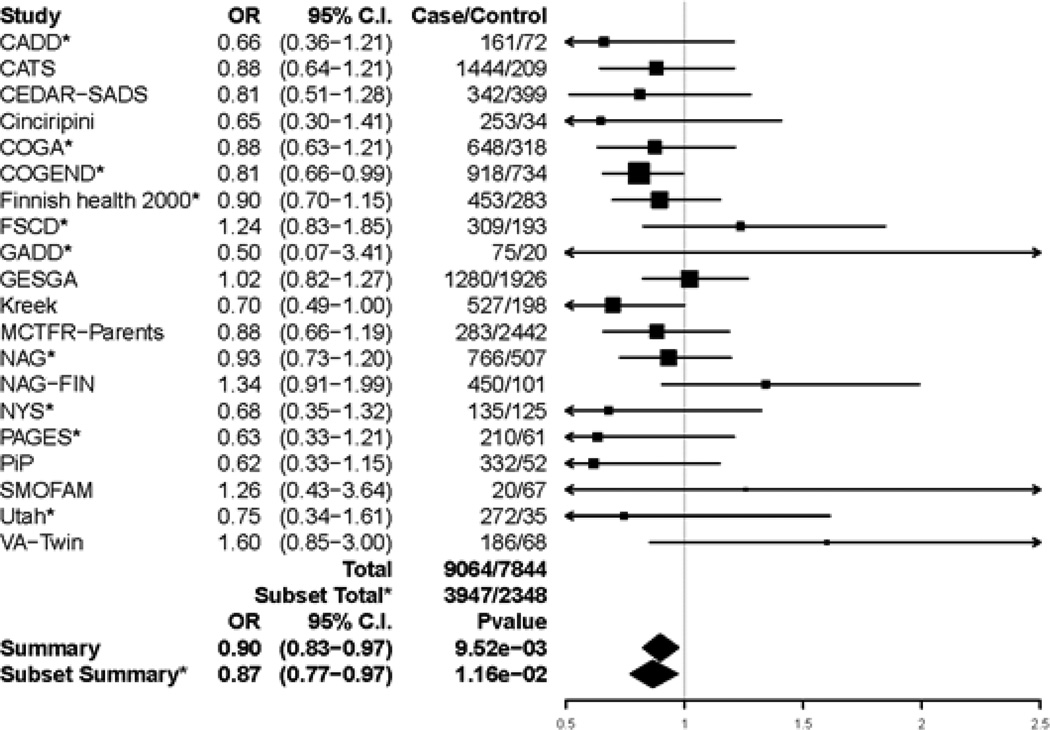
Figure 2.
Forest plot of general substance dependence and rs1799971 across studies that had at least 5 cases and 5 controls. Summary odds ratio, 95% Confidence Interval, and p-values are based on fixed effect meta-analysis. *indicates the subset of 10 studies that had all five specific substance dependence diagnoses, examined in secondary analyses to confirm consistency of results. Estimated heterogeneity variance was Q = 20.13 with a p-value of 0.387 among all 20 studies and Q = 6.49 with a p-value of 0.69 among the subset of 10 studies.

