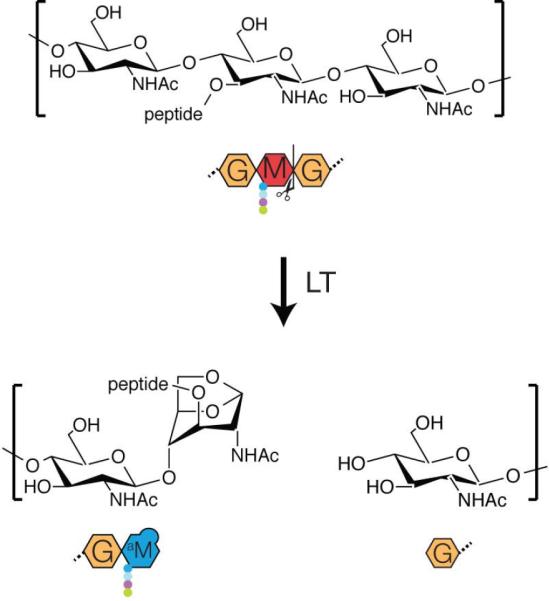
Figure 1. Lytic transglycosylase reaction.

Diagram showing the lytic transglycosylase reaction. Strand cleavage results in the formation of an anhMurNAc sugar at what would normally be the reducing end of the polysaccharide. Shown below the chemical structures are cartoon representations of the substrate and products.
