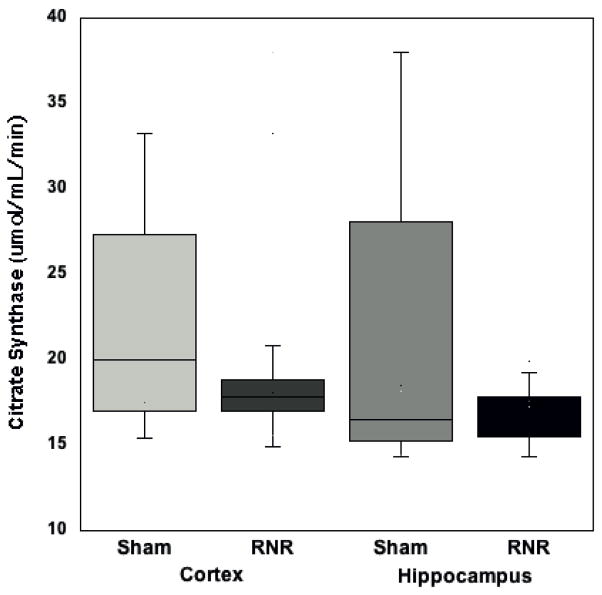
Figure 2. Citrate synthase activity.
24 hours post-RNR there was a no significant decrease in citrate synthase activity in either region compared to sham animals (p=0.19 hippo and p=0.29 cortex). Boxplots: Horizontal lines represent the median CS activity, with the box representing the 25th and 75th percentiles, the whiskers the 5th and 95th percentiles, and the outliers

