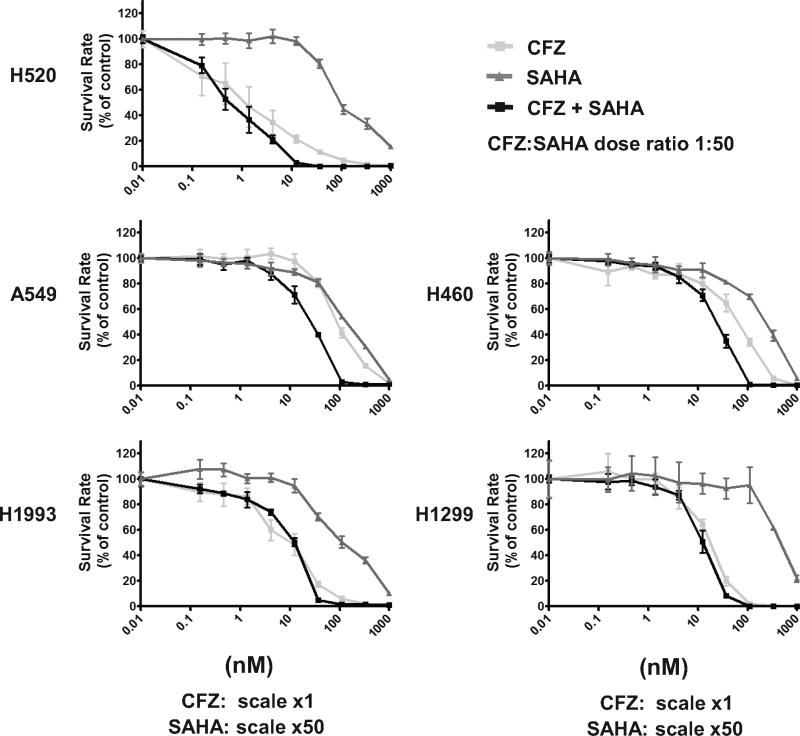
Figure 1. Dose response curves illustrate the effect of CFZ and SAHA, alone and in combination, on the growth of NSCLC cell lines.
Cells were exposed to CFZ, SAHA, or the combination, at various concentrations for 72 hours and assayed by MTT as described in the Materials and Methods section. One representative experiment is shown, n=6.

