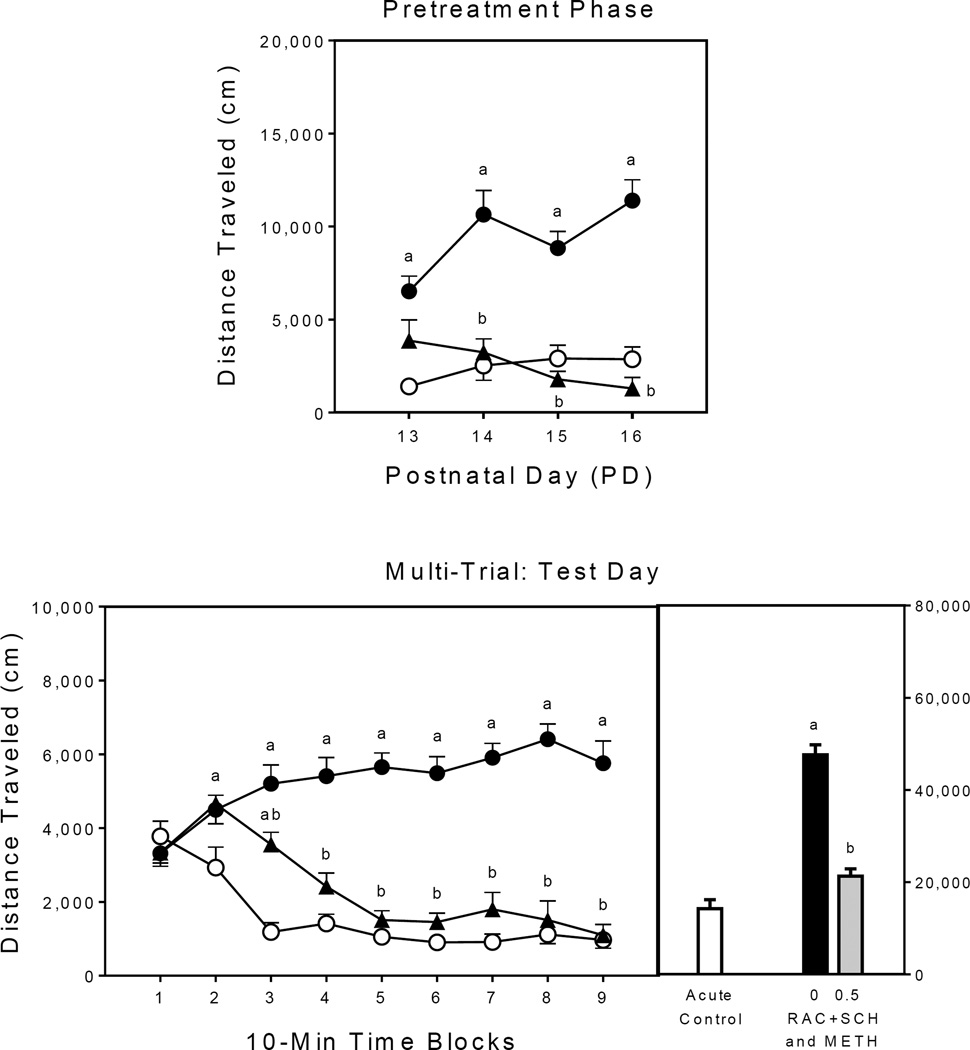
Fig. 2.
Mean distance traveled scores (±SEM) of rats (n = 8 per group) during the pretreatment phase (upper graph) and on the test day (lower graph) of Experiment 2. The right panel represents total distance traveled collapsed across the testing session. Open circle = SAL–SAL (acute control group); filled circle = 0 mg/kg RAC+SCH–METH (methamphetamine alone group); filled triangle = 0.5 mg/kg RAC+SCH–METH. (a) Significantly different from the SAL–SAL group (acute control group; open circles); (b) Significantly different from the 0 mg/kg RAC+SCH–METH group (methamphetamine alone group; filled circles).

