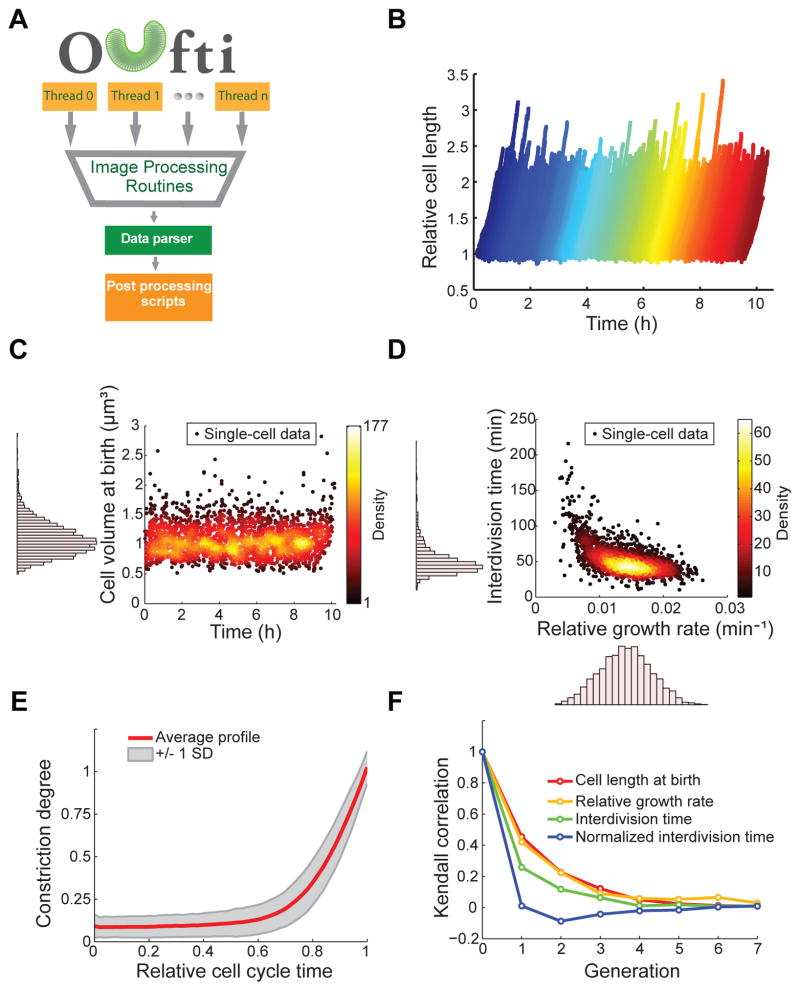
Fig. 2. High throughput analysis of a microfluidic experiment with Oufti.
(A) Oufti work-flow includes parallel computation, exploiting multiple threads on the user’s computer. Following image processing (cell segmentation, cell detection, cell mesh creation, cell joining and/or splitting, etc.), a data parser for the text-formatted output organizes data to be analyzed with various post-processing functions. (B) Wild-type E. coli strain BW25113 was grown in microfluidic chambers in M9 supplemented medium at 30°C for about 10 h. Cells were detected and tracked over time using the subpixel algorithm. The plot shows the growth of each cell (normalized by length at birth) during the 10-h experiment. (C–F) Note that all plots were created with MATLAB scripts using the Oufti output results. These plots are presented as examples of post-analysis that can be done with Oufti-generated datasets. (C) Scatter plot of cell volume at birth versus time (n = 2,234 cells). The distribution of cell volumes at birth is shown as a histogram along the y-axis of the scatter plot. (D) Scatter plot of the interdivision time versus the relative growth rate (n = 2,234 cells). The distribution of both parameters is shown as a histogram along the corresponding axis. The relative growth rate was calculated by fitting LbeBt to cell length as a function of time, where Lb is cell length at birth, B is the growth rate and t is time. (E) The red line ± 1 SD (gray shading) shows the average cell constriction profile for the detected 2,234 cells, from no detectable constriction (constriction degree = 0) to cell division (constriction degree = 1). (F) Degree of correlation (Kendall rank sum correlation coefficient) from one generation to another for the cell length at birth, the relative growth rate, the interdivision time and the normalized interdivision time.

