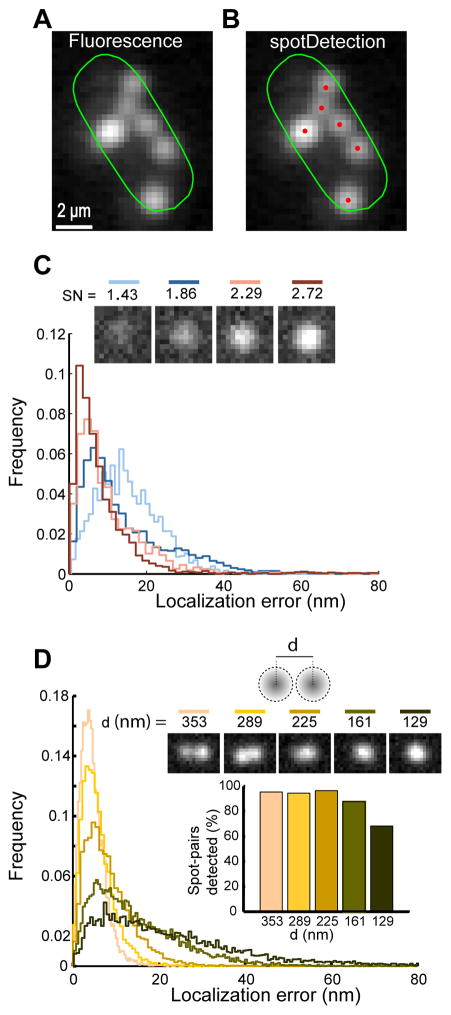
Fig. 5. Detection and quantitative characterization of fluorescently labeled SgrS RNAs using spotDetection.
(A) Probing E. coli SgrS small RNA using FISH microscopy reveals multiple fluorescent spots. The fluorescence image with Oufti cell contour is shown in log-scale to visualize the full spectrum of fluorescence spot intensities. (B) same as (A) but with spotDetection identification of fluorescent RNA foci (in red). (C) Localization error of spotDetection on diffraction-limited spots of varying signal-to-noise ratios (SN) from simulated images. Spots were detected using optimized parameters. Top inset shows example of single spots with corresponding SN values. Even when multiple Gaussian fitting was used, all spots were classified as single spots and fit with a single Gaussian. (D) Spot localization error for simulated spot pairs separated by a fixed distance d (top inset shows representative examples of spot pairs with their inter-spot distances). Graph inset shows the fraction of detected spot pairs as a function of inter-spot distance.

