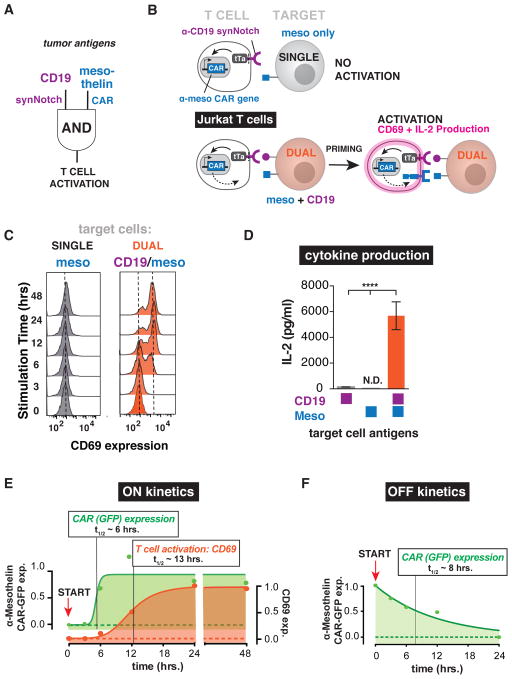
Figure 2. SynNotch Regulated CAR Expression – Combinatorial Antigen Requirement for Jurkat T cell Activation.
(A) Engineering a two-receptor AND-gate circuit: α-CD19 synNotch receptor induces α-mesothelin CAR expression.
(B) Jurkat T cells were engineered with the α-CD19 synNotch tTa receptor and the corresponding response elements controlling α-mesothelin 4-1BBζ CAR expression. The Jurkat T cells must first recognize CD19 on the target tumor via their synNotch receptor to initiate CAR expression. After the T cell is primed to activate by CD19, the α-mesothelin CAR can then bind mesothelin and activate the Jurkat cell. Two canonical markers of T cell activation are CD69 upregulation and IL-2 production. The synNotch AND gate Jurkat T cells should only activate when exposed to target tumor cells expressing both CD19 and mesothelin.
(C) Histograms of the activation marker CD69 in synNotch AND-gate Jurkat T cells co-cultured with single antigen (mesothelin only) or dual antigen (CD19/mesothelin) K562 tumor cells over a 48-hour timecourse. CD69 was only expressed when the T cells were exposed to dual antigen K562 cells (representative of 3 independent experiments).
(D) IL-2 ELISA showing IL-2 production by synNotch AND-gate Jurkat cells only when exposed to dual antigen K562 cells (n=3, error bars are SEM, significance determined by Student’s t-test, **** = P ≤ 0.0001)
(E) Timecourse of AND-gate T cell activation upon stimulation with dual antigen K562 cells. Expression of the GFP-tagged mesothelin CAR (green) occurs with a half-time of ~6 hours. Subsequently, activation of the T cell by CAR activation (monitored by CD69 expression) then occurs with a lag of several more hours (t1/2 ~13 hrs). FACS histograms for CAR expression are shown in Figure S1B.
(F) Timecourse of AND-gate T cell inactivation upon removal of synNotch ligand. Jurkat T cells expressing the AND-gate circuit were stimulated for 24 hours by plate-bound α-Myc antibody (synNotch receptor has extracellular Myc-tag). START indicates time at which cells were removed from the ligand, and the decay of GFP tagged CAR expression was monitored (t1/2 ~8 hrs). FACS histograms for CAR expression are shown in Figure S1C.

