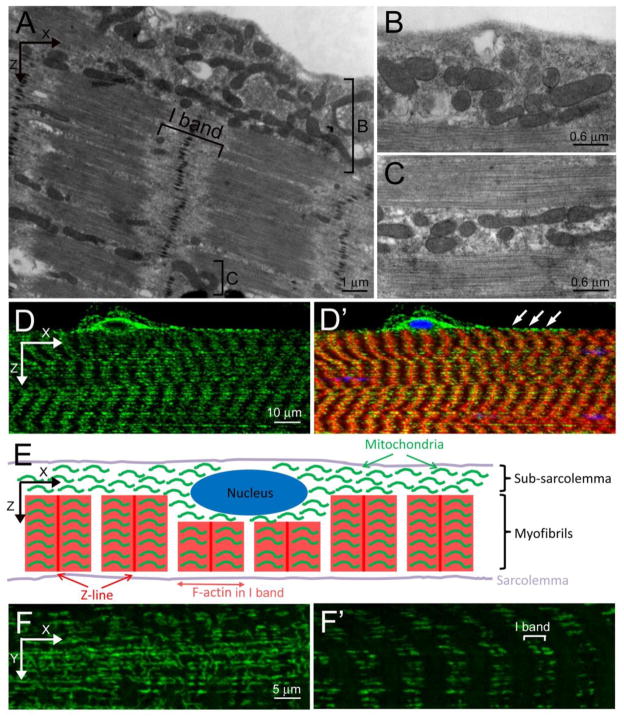
Figure 2. Mitochondrial positioning in larval muscles.
(A–C) TEM images of L3 muscles. (A) Mitochondria are loosely organized in the subsarcolemmal space (bracket labeled B) and appear closer together between the myofibrils (bracket labeled C). Panels B and C are higher magnification images corresponding to the regions bracketed in A. (D, D′) Confocal micrographs of a lateral view of L3 muscle stained with anti-ATPase 5α to label mitochondria (green), sarcomeric actin (red) and nuclei (blue). (E) Schematic illustration of mitochondrial distribution in a Drosophila L3 muscle cell. (F, F′) Anti-ATPase 5α immunostaining of mitochondria (green) in the subsarcolemmal plane (F) or within the myofibers (F′). Scale bars are indicated.

