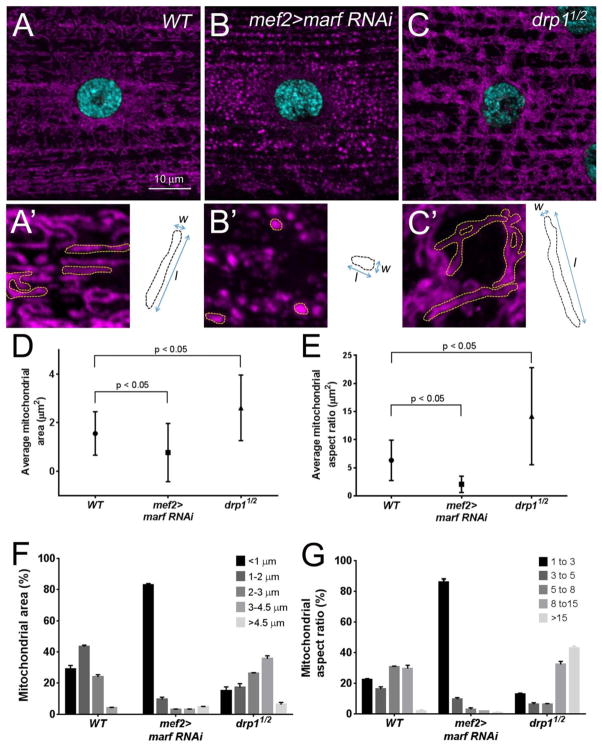
Figure 4. Quantitation of mitochondrial shape.
(A–C′) Immunofluorescent images of the SS mitochondria (magenta) surrounding a single nuclei (blue) in L3 muscles. Individual organelles are outlined in yellow (A′-C′). (A, A′) Mitochondria in WT muscles exhibit a variety of shapes, being predominantly tubular. Knockdown of the fusion gene marf results in small, circular mitochondria (B, B′), while longer organelles are present upon loss of the fission gene drp1 (C,C′). (D–G) Quantitation of mitochondrial area illustrated by dotted black lines (shown in A′-C′) and the aspect ratio (mitochondrial length/width as shown in A′-C′). Representative images of mitochondrial immunostaining were taken at 63×/1.6× zoom (0.34 μm/step) around one nucleus from muscle 6 or 7. ImageJ was used to stack all images from the sarcolemmal surface and for subsequent mitochondrial morphology analysis. For quantification of mitochondrial area, individual mitochondrion were outlined using the freehand selection tool and the area (pixels2) was calculated using the measure function. The area was converted to μm2 based upon the magnification used for image acquisition (1 pixel2 = 0.0036 μm2). To calculate the aspect ratios, the freehand selection tool and measure function were used to determine the distance of the major [length (l)] and minor [width (w)] axes. The raw data was transferred into Microsoft Excel to calculate the aspect ratio (l/w). Computed values were imported into Prism5 and one-way ANOVA was used for statistical analysis (mean = +/− SEM). n = 180 individual mitochondrion for each genotype. (D, E) The average area of a mitochondria is decreased in marf RNAi and increased in drp1 mutant muscles. (F, G) This same trend is apparent for measurements of the mitochondrial aspect ratio. Scale bars are indicated.

