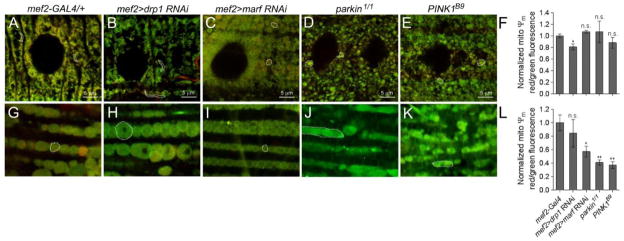
Figure 5. Measuring mitochondrial ΔΨm.
(A–E, G–K) JC-1 staining of the mitochondria in larval muscles (A–E) or the adult musculature (G–K) in the indicated genotypes. Individual mitochondrion are outlined (dotted lines). (F,L) Quantitative measurements of the red (high ΔΨm):green (low ΔΨm) ratio in larvae or adult muscles. Live dissections of larvae or bisections of the adult thorax were performed in HL3 buffer and JC-1 (in HL3 buffer) was added at 1:800 dilution for 10 min at 25° C. Samples were washed twice and mounted for imaging. Fluorescence micrographs were taken at excitation wavelengths of 488 and 555 nm. The raw data was transferred into Microsoft Excel to calculate the red:green fluorescence ratios. Computed values were imported into Prism5 and a student-test was used for statistical analysis (mean = +/− SEM). n = 6 for each genotype. (n.s., not significant, * P<0.05, **P<0.01) Scale bars are indicated.

